
Ontario Cancer Statistics 2020 Ch 1: Estimated Current Cancer Incidence
Incidence measures the number of new cases of cancer diagnosed within a specific timeframe. This chapter reports projections for the years 2017 to 2020.
What's on this page
Incidence Overview
The number of new cancer cases diagnosed each year in Ontario (the incidence) and the incidence rate have increased each year since at least 1981. In general, the incidence of cancer is influenced by these factors:
- Socio-demographic factors (e.g., age, place of residence)
- The availability of early detection and screening for cancer
- The prevalence of risk and protective factors
Risk factors can include the following:
- Unhealthy behaviours (e.g., smoking, poor diet, alcohol consumption, physical inactivity)
- Previous treatments (e.g., hormone-replacement therapy use)
- Exposure to certain environmental and occupational carcinogens (e.g., radon, fine particulate matter, UV [ultraviolet] rays, asbestos, diesel engine exhaust)
- Medical conditions and infectious agents (e.g., Crohn’s disease, HPV)
- Non-modifiable factors (e.g., age at first menstrual cycle, menopause, family history of cancer)
- Genetic predispositions (e.g., BRCA1 and BRCA2 genes)
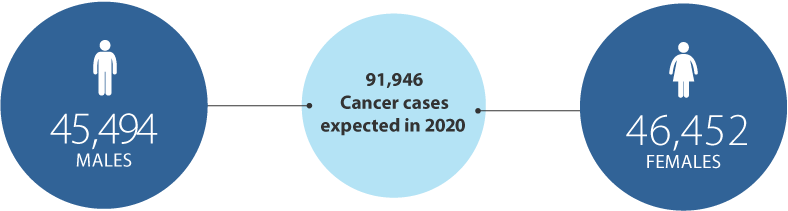
In 2020, Ontarians are expected to be diagnosed with an estimated 91,946 new cases of cancer (excluding non-melanoma skin cancer). This will result in an age-standardized incidence rate of 551.8 cases per 100,000 people (Figure 1.1).
The figure shows an abrupt increase in the count and incidence rate seen in 2010, which is a result of the Ontario Cancer Registry’s adoption of the National Cancer Institute (NCI) Surveillance, Epidemiology and End Results (SEER) Program’s rules for counting multiple primary cancers. Those rules were applied starting in diagnosis year 2010, which means the higher numbers observed starting that year reflect an adoption of these new rules and not a true increase in the incidence of cancer (see Analysis for more information).[1]
Incidence by Sex
Among males, 45,494 cases of cancer are expected to be diagnosed in 2020 for an ASIR of 577.2 per 100,000 (Figure 1.2). The rapid drop in the count and rate after 2011 is partly because of the declining rate of prostate cancer. This decline followed recommendations from the U.S. Preventive Services Task Force against using prostate-specific antigen (PSA) testing for the routine screening of healthy males.[2] Similar recommendations for PSA testing in Canada were published by the Canadian Task Force on Preventive Health Care in 2014.[3]
The numbers are higher for females, with 46,452 cases diagnosed for an ASIR of 536.0 per 100,000 (Figure 1.2). The incidence rate has been higher for males than females every year since 1981. This sex difference has been observed in many other jurisdictions.[4,5] Higher rates of cancer among males have been attributed to differences in behaviour,[6,7] immunity,[8] hormones[9] and exposures (e.g., workplace exposures)[10,11] between the sexes[12,13].
Incidence by Cancer Type
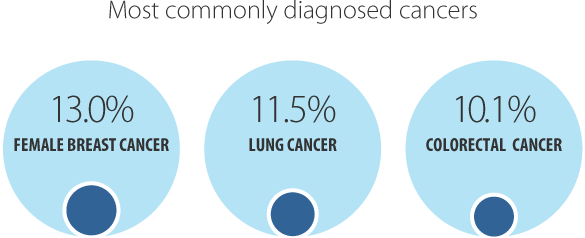
In 2020, the most commonly diagnosed cancer is expected to be female breast cancer (11,945 cases or 13.0% of all new cases), followed by lung cancer (10,592 cases or 11.5%) and colorectal cancer (9,245 cases or 10.1%) (Table 1.1). These 3 cancers alone are projected to account for almost 34.6% of all new cancers diagnosed in 2020.
Among males, the most commonly diagnosed cancer is expected to be prostate cancer, with an ASIR of 103.8 per 100,000. Breast cancer (with an ASIR of 142.8 per 100,000) is projected to be the most commonly diagnosed cancer among females.
The ASIR is expected to be higher in males than females for all cancer types listed in Table 1.1. A higher prevalence of certain risk factors are suspected reasons for this discrepancy. These include:
- obesity, alcohol and tobacco use among males
- occupational exposure to carcinogens
- lower use of medical services compared with females
- the influence of sex hormones
Some notable differences exist between the sexes. The number of new thyroid cancer cases in females, for example, will outnumber male cases by nearly 3-to-1. Possible reasons for the higher incidence of this cancer include:
- increased likelihood of diagnostic investigation in women for thyroid cancer[14]
- women’s greater tendency in general to seek medical attention[6,7,13]
- biological differences such as levels of thyroid stimulated hormone and sex steroids,[15-17] as well as female reproductive history[18]
The incidence of less aggressive types of thyroid cancer (e.g., papillary thyroid cancer) has been higher in females than males in a number of jurisdictions. However, the incidence of more aggressive types (e.g., anaplastic and medullary) is generally similar between the sexes.[14,19] As a result, thyroid mortality rates have been fairly equal between males and females (see Chapter 6: Cancer Mortality Rates and Trends).
In addition to thyroid cancer, bladder and liver cancers are expected to have the biggest differences in cancer incidence between the sexes:
- For bladder cancer, the male incidence rate will be almost 4 times the female rate. One of the risk factors for bladder cancer is a history of smoking, with smokers being 2 to 3 times as likely to develop bladder cancer as non-smokers.[20,21] Tobacco use is more common in males, which may be one of the reasons bladder cancer incidence is much higher in males.[22]
- For liver cancer, the male incidence rate is almost 2 times the female rate. Higher male prevalence of risk factors such as alcohol use and smoking may account for some of the discrepancy.[23-25] However, recent research suggests there may be genetic differences in the way males and females respond to chronic inflammation caused by infections such as hepatitis B or hepatitis C viruses, the most common liver cancer risk factors.[26-28]
| Cancer type | Both sexes - new cases | Both sexes - ASIR | Males - new cases | Males - ASIR | Females - new cases | Females - ASIR |
|---|---|---|---|---|---|---|
| All cancers | 91,946 | 551.8 | 45,494 | 577.2 | 46,452 | 536.0 |
| Bladder | 4,320 | 24.7 | 3,329 | 41.9 | 991 | 10.5 |
| Brain | 1,214 | 7.7 | 695 | 9.2 | 519 | 6.3 |
| Breast (female) | 11,945 | 142.8 | n/a | n/a | 11,945 | 142.8 |
| Cervix | 553 | 7.3 | n/a | n/a | 553 | 7.3 |
| Colorectal | 9,245 | 54.4 | 5,047 | 64.1 | 4,198 | 45.9 |
| Esophagus | 984 | 5.8 | 755 | 9.5 | 229 | 2.4 |
| Hodgkin lymphoma | 398 | 2.7 | 209 | 2.9 | 189 | 2.5 |
| Kidney | 2,904 | 17.8 | 1,918 | 24.9 | 986 | 11.3 |
| Larynx | 402 | 2.4 | 342 | 4.3 | 60 | 0.7 |
| Leukemia | 2,796 | 16.8 | 1,621 | 20.9 | 1,175 | 13.3 |
| Liver | 1,802 | 10.5 | 1,181 | 14.7 | 621 | 6.8 |
| Lung | 10,592 | 60.8 | 5,127 | 64.0 | 5,465 | 58.5 |
| Melanoma | 4,364 | 26.4 | 2,539 | 32.8 | 1,825 | 21.5 |
| Myeloma | 1,526 | 8.9 | 877 | 11.1 | 649 | 7.0 |
| Non-Hodgkin lymphoma | 5,490 | 33.0 | 3,154 | 40.7 | 2,336 | 26.3 |
| Oral cavity & pharynx | 2,067 | 12.7 | 1,506 | 19.5 | 561 | 6.4 |
| Ovary | 1,277 | 15.2 | n/a | n/a | 1,277 | 15.2 |
| Pancreas | 2,533 | 14.7 | 1,352 | 17.1 | 1,181 | 12.6 |
| Prostate | 8,528 | 103.8 | 8,528 | 103.8 | n/a | n/a |
| Stomach | 1,826 | 10.8 | 1,161 | 14.8 | 665 | 7.4 |
| Testis | 490 | 7.0 | 490 | 7.0 | n/a | n/a |
| Thyroid | 4,109 | 27.6 | 1,118 | 15.1 | 2,991 | 39.6 |
| Uterus | 3,355 | 39.4 | n/a | n/a | 3,355 | 39.4 |
Abbreviations:
- ASIR means age-standardized incidence rate.
- N/a means not applicable.
Notes:
- Rates are per 100,000 and standardized to the age distribution of the 2011 Canadian population.
- Projected incidence rates are based on the NCI SEER standards for counting multiple primary cancers, adopted by the Ontario Cancer Registry for cases diagnosed in 2010 and beyond.
- Projections are based on malignant cases only (excluding non-melanoma skin cancer).
Analysis by: Surveillance, Analytics and Informatics, Ontario Health (Cancer Care Ontario)
Data source: Ontario Cancer Registry (December 2018), Ontario Health (Cancer Care Ontario)
Incidence by Age
The greatest number of new cancer cases is expected in people ages 60 to 79. An estimated 54.5% of all cases in 2020 are projected to be diagnosed in this age group (Table 1.2). The next most common age group for new cancer cases will be people ages 40 to 59 (22.0%) followed by those 80 and older (18.7%). Only 4.8% of cases are expected to be diagnosed in those under the age of 40.
The incidence rate in 2020 is projected to range from 62.6 per 100,000 in those ages 39 and under to 2,501.4 per 100,000 in people ages 80 and older. The projected rates for 2020:
- increase with advancing age for bladder, breast, colorectal, kidney, liver, lung and pancreatic cancers, and melanoma
- increase with advancing age for cervical and thyroid cancers but peak in those 40 to 59 years, the ages at which these cancers are most common
- increase with advancing age for prostate and uterine cancer but peak in those 60 to 79 years, the ages at which these cancers are most common.

The incidence rates of the 23 cancers reported in Table 1.2 are projected to be very low in those under the age of 40. The exceptions are breast cancer, at 15.6 per 100,000, and thyroid cancer, at 10.8 per 100,000.
| Cancer type | Ages 0 - 39 years | Ages 40 - 59 years | Ages 60 - 79 years | Ages 80 years or older | ||||
|---|---|---|---|---|---|---|---|---|
| New cases | Age-specific rate | New cases | Age-specific rate | New cases | Age-specific rate | New cases | Age-specific rate | |
| All cancers | 4,379 | 62.6 | 20,215 | 516.6 | 50,120 | 1,699.1 | 17,232 | 2,501.4 |
| Bladder | 30 | 0.4 | 480 | 12.3 | 2,509 | 85.1 | 1,301 | 188.9 |
| Brain | 241 | 3.4 | 311 | 7.9 | 519 | 17.6 | 143 | 20.8 |
| Breast (female) | 541 | 15.6 | 3,997 | 201.1 | 5,826 | 378.4 | 1,581 | 385.4 |
| Cervix | 142 | 4.1 | 239 | 12.0 | 144 | 9.4 | 28 | 6.8 |
| Colorectal | 156 | 2.2 | 1,724 | 44.1 | 5,005 | 169.7 | 2,360 | 342.6 |
| Esophagus | 7 | 0.1 | 180 | 4.6 | 580 | 19.7 | 217 | 31.5 |
| Hodgkin lymphoma | 207 | 3.0 | 87 | 2.2 | 83 | 2.8 | 21 | 3.0 |
| Kidney | 110 | 1.6 | 835 | 21.3 | 1,537 | 52.1 | 422 | 61.3 |
| Larynx | ** | ** | 72 | 1.8 | 258 | 8.7 | 68 | 9.9 |
| Leukemia | 314 | 4.5 | 481 | 12.3 | 1,366 | 46.3 | 635 | 92.2 |
| Liver | 27 | 0.4 | 301 | 7.7 | 1,110 | 37.6 | 364 | 52.8 |
| Lung | 50 | 0.7 | 1,314 | 33.6 | 6,657 | 225.7 | 2,571 | 373.2 |
| Melanoma | 305 | 4.4 | 990 | 25.3 | 2,126 | 72.1 | 943 | 136.9 |
| Myeloma | 12 | 0.2 | 256 | 6.5 | 869 | 29.5 | 389 | 56.5 |
| Non-Hodgkin lymphoma | 351 | 5.0 | 1,104 | 28.2 | 2,866 | 97.2 | 1,169 | 169.7 |
| Oral cavity & pharynx | 56 | 0.8 | 621 | 15.9 | 1,132 | 38.4 | 258 | 37.5 |
| Ovary | 84 | 2.4 | 391 | 19.7 | 604 | 39.2 | 198 | 48.3 |
| Pancreas | 35 | 0.5 | 398 | 10.2 | 1,410 | 47.8 | 690 | 100.2 |
| Prostate | 0 | 0.0 | 1,343 | 69.8 | 6,303 | 447.0 | 882 | 316.5 |
| Stomach | 41 | 0.6 | 364 | 9.3 | 974 | 33.0 | 447 | 64.9 |
| Testis | 335 | 9.5 | 127 | 6.6 | 25 | 1.8 | ** | ** |
| Thyroid | 757 | 10.8 | 1,838 | 47.0 | 1,373 | 46.5 | 141 | 20.5 |
| Uterus | 64 | 1.8 | 1,054 | 53.0 | 1,908 | 123.9 | 329 | 80.2 |
Symbol: ** Suppressed due to small case count (count less than 6).
Notes:
- Rates are per 100,000
- Projected incidence rates are based on the NCI SEER standards for counting multiple primary cancers, adopted by the Ontario Cancer Registry for cases diagnosed in 2010 and beyond.
- Projections are based on malignant cases only.
Analysis by: Surveillance, Analytics and Informatics, Ontario Health (Cancer Care Ontario)
Data source: Ontario Cancer Registry (December 2018), Ontario Health (Cancer Care Ontario)
Among people ages 40 to 59, female breast cancer will account for the largest proportion of all cases in this age group (19.8%). In those ages 60 to 79, lung (13.3%), prostate (12.6%) and breast (11.6%) will be the most common cancers diagnosed. Among the oldest Ontarians — those 80 years and older — lung will be the most commonly diagnosed cancer (14.9%), followed by colorectal cancer (13.7%).
For more information on cancer incidence in Ontario, including data on more cancer types and trends over time, see Chapter 5: Cancer Incidence Rates and Trends.