
Ontario Cancer Statistics 2020 Ch 2: Estimated Current Cancer Mortality
Mortality measures the number of deaths caused by cancer. This chapter reports projections for the years 2017 to 2020.
What's on this page
Mortality Overview
While the number of deaths (mortality) from all cancers in Ontario has increased over the past 3 decades, the mortality rate has declined. In general, cancer mortality is affected by:
- the incidence of cancer
- cancer survival
- socio-demographic factors
- the availability of and effectiveness of early detection and screening for cancer in extending life
- the availability of and access to effective treatment for cancer
Mortality Counts and Rates
In 2020, an estimated 30,975 people in Ontario are expected to die from cancer (excluding non-melanoma skin cancer). That represents an age-standardized mortality rate (ASMR) of 178.0 out of every 100,000 people (Figure 2.1). While the number of cancer deaths has increased each year since 1981, the ASMR peaked in 1988 and has decreased every year since 1999.
Mortality by Sex
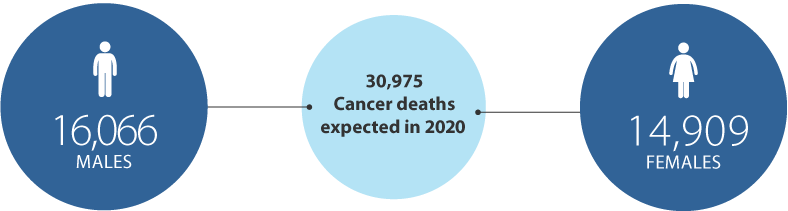
Among males, cancer is expected to cause 16,066 deaths in 2020. This will result in an ASMR of 205.0 per 100,000 (Figure 2.2). The numbers are expected to be lower for females, with 14,909 expected deaths, for an ASMR of 157.6 per 100,000. Males are projected to account for 51.9% of all cancer deaths in 2020. This number has decreased slightly over time. In 1981, males accounted for 54.2% of all cancer deaths.
Mortality by Cancer Type
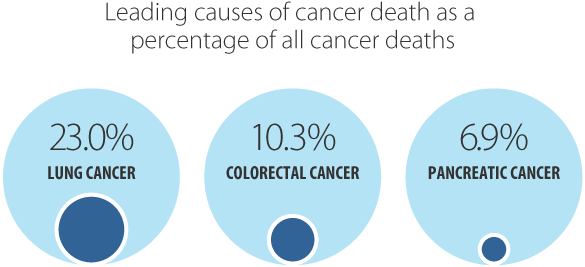
In 2020, the leading cause of cancer death is expected to be lung cancer, projected to account for 23.0% of all cancer deaths (7,124 deaths). This will be followed by colorectal (3,194 deaths or 10.3%) and pancreatic cancers. Despite having a much lower incidence[*], pancreatic cancer is projected to cause more deaths (2,152 deaths or 6.9 %) than female breast cancer (1,980 deaths or 6.4%).
Despite having a much lower incidence, pancreatic cancer is projected to cause more deaths than female breast cancer.
Lung cancer will also be the leading cause of cancer death for both males and females, although the ASMR is projected to be significantly higher for males (45.7 per 100,000) than females (36.4 per 100,000).
For all of the cancers listed in Table 2.1, the ASMR is expected to be higher for males than females. The higher male mortality rates can be attributed to generally higher incidence rates among males for every cancer that occurs in both sexes, which is due to:
- a higher prevalence of risk factors such as obesity, alcohol and tobacco use among males[1]
- greater occupational exposure to carcinogens[2,3]
- lower use of medical services compared with females[4-6]
- the influence of sex hormones[7]
The biggest differences in cancer mortality between males and females in 2020 are expected to be for:
- bladder, and oral cavity and pharyngeal cancers, for which the male ASMR will be about 3 times the female rate
- kidney and liver cancers, and melanoma, for which the male ASMR will be more than twice the female rate
| Cancer type | Both sexes - deaths | Both sexes - ASMR | Males - deaths | Males - ASMR | Females - deaths | Females - ASMR |
|---|---|---|---|---|---|---|
| All cancers | 30,975 | 178.0 | 16,066 | 205.0 | 14,909 | 157.6 |
| Bladder | 982 | 5.5 | 706 | 9.2 | 276 | 2.7 |
| Brain | 945 | 5.8 | 521 | 6.8 | 424 | 4.9 |
| Breast (female) | 1,980 | 21.9 | n/a | n/a | 1,980 | 21.9 |
| Cervix | 185 | 2.3 | n/a | n/a | 185 | 2.3 |
| Colorectal | 3,194 | 18.3 | 1,694 | 21.8 | 1,500 | 15.4 |
| Esophagus | 913 | 5.3 | 716 | 9.0 | 197 | 2.0 |
| Hodgkin lymphoma | 42 | 0.3 | 25 | 0.3 | 17 | 0.2 |
| Kidney | 669 | 3.8 | 447 | 5.7 | 222 | 2.3 |
| Larynx | 130 | 0.7 | 109 | 1.4 | 21 | 0.2 |
| Leukemia | 1,212 | 6.9 | 708 | 9.1 | 505 | 5.2 |
| Liver | 1,454 | 8.4 | 916 | 11.5 | 538 | 5.7 |
| Lung | 7,124 | 40.5 | 3,648 | 45.7 | 3,476 | 36.4 |
| Melanoma | 580 | 3.4 | 378 | 4.9 | 202 | 2.2 |
| Myeloma | 620 | 3.5 | 349 | 4.4 | 271 | 2.8 |
| Non-Hodgkin lymphoma | 1,110 | 6.4 | 630 | 8.1 | 480 | 4.9 |
| Oral cavity & pharynx | 503 | 2.9 | 348 | 4.4 | 155 | 1.6 |
| Ovary | 723 | 7.9 | n/a | n/a | 723 | 7.9 |
| Pancreas | 2,152 | 12.3 | 1,084 | 13.7 | 1,068 | 11.1 |
| Prostate | 1,670 | 21.7 | 1,670 | 21.7 | n/a | n/a |
| Stomach | 788 | 4.6 | 481 | 6.2 | 307 | 3.3 |
| Testis | 14 | 0.2 | 14 | 0.2 | n/a | n/a |
| Thyroid | 95 | 0.5 | 47 | 0.6 | 48 | 0.5 |
| Uterus | 559 | 6.0 | n/a | n/a | 559 | 6.0 |
Abbreviations:
- ASMR means age-standardized mortality rate.
- N/a means not applicable.
Note: Rates are per 100,000 and standardized to the age distribution of the 2011 Canadian population.
Analysis by: Surveillance, Analytics and Informatics, Ontario Health (Cancer Care Ontario)
Data source: Ontario Cancer Registry (December 2018), Ontario Health (Cancer Care Ontario)
Mortality by Age
In 2020, the highest cancer mortality rate is expected to be in the 80 years and older age group, followed by the 60 to 79 age group. The latter group, however, will account for an estimated 50.5% of all deaths that year compared with 36.0% for the older age group (Table 2.2).
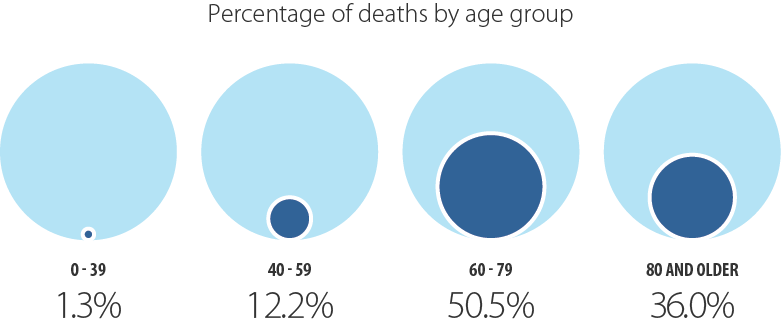
Deaths from cancer before the age of 40 will continue to be uncommon in 2020, with only 399 deaths expected. This represents 1.3% of all cancer deaths, or a rate of 5.7 deaths per 100,000 people.
Although projected mortality rates increase substantially beginning at ages 60 to 79, the exceptions are for breast and lung cancers. The rates for these cancers begin to increase rapidly much earlier, in the 40 to 59 age group.
| Cancer type | Ages 0 - 39 years | Ages 40 - 59 years | Ages 60 - 79 years | Ages 80 years or older | ||||
|---|---|---|---|---|---|---|---|---|
| Deaths | Age-specific rate | Deaths | Age-specific rate | Deaths | Age-specific rate | Deaths | Age-specific rate | |
| All cancers | 399 | 5.7 | 3,797 | 97.0 | 15,636 | 530.1 | 11,143 | 1,617.5 |
| Bladder | ** | ** | 49 | 1.3 | 401 | 13.6 | 531 | 77.1 |
| Brain | 75 | 1.1 | 231 | 5.9 | 490 | 16.6 | 149 | 21.6 |
| Breast (female) | 57 | 1.6 | 442 | 22.2 | 843 | 54.8 | 638 | 155.5 |
| Cervix | 17 | 0.5 | 71 | 3.6 | 69 | 4.5 | 28 | 6.8 |
| Colorectal | 30 | 0.4 | 368 | 9.4 | 1,452 | 49.2 | 1,344 | 195.1 |
| Esophagus | ** | ** | 143 | 3.7 | 515 | 17.5 | 250 | 36.3 |
| Hodgkin lymphoma | 6 | 0.1 | 6 | 0.2 | 20 | 0.7 | 10 | 1.5 |
| Kidney | ** | ** | 87 | 2.2 | 335 | 11.4 | 243 | 35.3 |
| Larynx | 0 | 0.0 | 12 | 0.3 | 73 | 2.5 | 45 | 6.5 |
| Leukemia | 44 | 0.6 | 104 | 2.7 | 558 | 18.9 | 506 | 73.5 |
| Liver | 18 | 0.3 | 183 | 4.7 | 838 | 28.4 | 415 | 60.2 |
| Lung | 15 | 0.2 | 702 | 17.9 | 4,256 | 144.3 | 2,151 | 312.2 |
| Melanoma | 18 | 0.3 | 92 | 2.4 | 277 | 9.4 | 193 | 28.0 |
| Myeloma | 0 | 0.0 | 59 | 1.5 | 330 | 11.2 | 231 | 33.5 |
| Non-Hodgkin lymphoma | 15 | 0.2 | 117 | 3.0 | 546 | 18.5 | 432 | 62.7 |
| Oral cavity & pharynx | ** | ** | 93 | 2.4 | 282 | 9.6 | 124 | 18.0 |
| Ovary | 10 | 0.3 | 128 | 6.4 | 388 | 25.2 | 197 | 48.0 |
| Pancreas | 9 | 0.1 | 264 | 6.7 | 1,177 | 39.9 | 702 | 101.9 |
| Prostate | 0 | 0.0 | 53 | 2.8 | 672 | 47.7 | 945 | 339.1 |
| Stomach | 12 | 0.2 | 131 | 3.3 | 381 | 12.9 | 262 | 38.0 |
| Testis | ** | ** | ** | ** | ** | ** | ** | ** |
| Thyroid | 0 | 0.0 | 12 | 0.3 | 50 | 1.7 | 33 | 4.8 |
| Uterus | ** | ** | 77 | 3.9 | 326 | 21.2 | 153 | 37.3 |
Symbol: ** Suppressed due to small case count (less than 6)
Note: Rates are per 100,000
Analysis by: Surveillance, Analytics and Informatics, Ontario Health (Cancer Care Ontario)
Data source: Ontario Cancer Registry (December 2018), Ontario Health (Cancer Care Ontario)
For more information on cancer mortality in Ontario, including data on more cancer types and trends over time, see Chapter 6: Cancer Mortality Rates and Trends.