
Ontario Cancer Statistics 2020 Ch 6: Cancer Mortality Rates and Trends
Mortality measures the number of deaths caused by cancer. This chapter presents actual (non-projected) cancer mortality rates and trends over time. These statistics are based on counts complete as of 2016 – the latest available year.
What's on this page
Cancer as a Leading Cause of Death
In 2016, cancer caused 29.3% of all deaths in Ontario, making it the province’s leading cause of death (Figure 6.1).[1] Cancer caused almost as many deaths as the next 3 leading causes of death combined: diseases of the heart, cerebrovascular diseases and accidents.
Probability of Dying From Cancer
The probability of dying from cancer represents the average chance of death due to cancer. This probability depends on many factors:
- population characteristics (e.g., demographics)
- prevalence of risk factors (e.g., smoking, obesity)
- current life expectancy
- treatment options available
These probabilities also reflect the average risks for the overall population and do not take into account personal risk. In other words, an individual’s risk may be higher or lower than the numbers reported here.
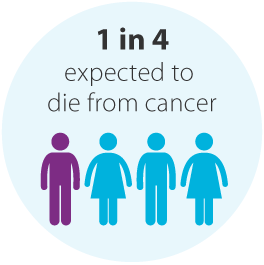
In Ontario, 1 in 4, or 25.5% of people, will die from cancer (Table 6.1). Males have a greater chance of dying from cancer, at slightly more than 1 in 4 (27.8%), compared with females, at 1 in 4 (23.5%).
As with the chance of developing cancer, the probability of dying from cancer varies based on cancer type:
- Among males, the probability is highest for lung (1 in 16), prostate (1 in 28) and colorectal (1 in 32) cancers.
- Among females, the probability is highest for lung (1 in 19) breast (1 in 31) and colorectal (1 in 36) cancers.
| Cancer type | Both sexes | Males | Females | |||
|---|---|---|---|---|---|---|
| % | 1 in | % | 1 in | % | 1 in | |
| All cancers | 25.5% | 4 | 27.8% | 4 | 23.5% | 4 |
| Bladder | 0.9% | 115 | 1.3% | 75 | 0.5% | 209 |
| Brain | 0.6% | 171 | 0.7% | 151 | 0.5% | 194 |
| Breast (female) | 3.2% | 31 | n/a | n/a | 3.2% | 31 |
| Cervix | 0.2% | 455 | n/a | n/a | 0.2% | 455 |
| Colorectal | 3.0% | 34 | 3.2% | 32 | 2.8% | 36 |
| Esophagus | 0.6% | 164 | 0.9% | 106 | 0.3% | 328 |
| Hodgkin lymphoma | 0.0% | 2639 | 0.0% | 2165 | 0.0% | 3322 |
| Kidney | 0.6% | 181 | 0.7% | 140 | 0.4% | 250 |
| Larynx | 0.1% | 909 | 0.2% | 544 | 0.0% | 2350 |
| Leukemia | 1.0% | 101 | 1.2% | 84 | 0.8% | 124 |
| Liver | 0.9% | 109 | 1.2% | 86 | 0.7% | 144 |
| Lung | 5.9% | 17 | 6.5% | 16 | 5.4% | 19 |
| Melanoma | 0.4% | 230 | 0.6% | 167 | 0.3% | 349 |
| Myeloma | 0.5% | 196 | 0.6% | 169 | 0.4% | 229 |
| Non-Hodgkin lymphoma | 1.0% | 101 | 1.1% | 91 | 0.9% | 112 |
| Oral cavity & pharynx | 0.4% | 251 | 0.6% | 182 | 0.3% | 395 |
| Ovary | 1.1% | 93 | n/a | n/a | 1.1% | 93 |
| Pancreas | 1.6% | 64 | 1.6% | 63 | 1.5% | 65 |
| Prostate | 3.6% | 28 | 3.6% | 28 | n/a | n/a |
| Stomach | 0.7% | 153 | 0.8% | 121 | 0.5% | 199 |
| Testis | 0.0% | 7070 | 0.0% | 7070 | n/a | n/a |
| Thyroid | 0.1% | 1248 | 0.1% | 1454 | 0.1% | 1109 |
| Uterus | 0.7% | 135 | n/a | n/a | 0.7% | 135 |
Analysis by: Surveillance, Analytics and Informatics, Ontario Health (Cancer Care Ontario)
Data source: Ontario Cancer Registry (December 2018), Ontario Health (Cancer Care Ontario)
Mortality by Sex and Cancer Type
In 2016, 29,074 people died from cancer in Ontario, for an age-standardized mortality rate (ASMR) of 190.0 per 100,000 (Table 6.2).
The 4 most commonly diagnosed cancers (lung, colorectal, breast and prostate) were responsible for almost 50% of all cancer deaths in 2016.
The 4 most commonly diagnosed cancers (lung, colorectal, breast and prostate) were responsible for almost 50% of all cancer deaths in 2016. Lung, colorectal and prostate cancers accounted for 44% of all male cancer deaths, while lung, breast and colorectal cancers accounted for 49% of all female cancer deaths (Figure 6.2).
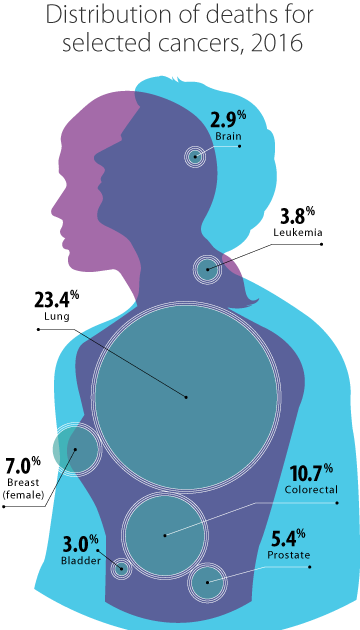
Some of the less commonly diagnosed cancers made a relatively large contribution to mortality because of their poor prognosis. For example, pancreatic cancer accounted for 6.5% of all cancer deaths in 2016 — more than prostate cancer and almost as much as breast cancer (Table 6.2).
The highest ASMR for cancers occurring in both sexes combined were for lung (44.2 per 100,000), colorectal (20.3 per 100,000) and pancreatic (12.3 per 100,000) cancers.
The ASMR for all cancers combined was significantly higher for males (224.4 per 100,000) than females (165.5 per 100,000). Among males, the highest ASMR was for lung (50.8 per 100,000), followed by colorectal (25.0 per 100,000) and prostate (24.4 per 100,000) cancers. For females, the highest ASMR was for lung (39.3 per 100,000), followed by breast (24.9 per 100,000) and colorectal (16.6 per 100,000) cancers.
Males had a consistently higher mortality rate than females for each type of cancer except thyroid. Thyroid cancer mortality rates were the same for both sexes.
The greatest differences between male and female mortality rates were seen in:
- Hodgkin lymphoma, for which the male rate was 5 times the female rate
- laryngeal cancer, for which the male rate was almost 5 times the female rate
- esophageal cancer, for which the male rate was 4 times the female rate
- bladder cancer, for which the male rate was over 3 times the female rate
- oral cavity and pharynx cancer, for which the male rate was close to 3 times the female rate
Males with Hodgkin lymphoma have generally poorer prognoses than females.[2] This may be because of biological differences between the sexes that affect how the disease progresses.[3] Tobacco use is a major risk factor for the remaining 4 cancers (laryngeal, esophageal, bladder, and oral cavity and pharynx). The higher mortality rates in males likely result from their historically higher rates of tobacco use.[4]
| Cancer type | Both sexes | Males | Females | ||||||||||||
|---|---|---|---|---|---|---|---|---|---|---|---|---|---|---|---|
| Deaths | % of deaths | Crude rate | ASMR† | ASMR 95% CI | Deaths | % of deaths | Crude rate | ASMR† | ASMR 95% CI | Deaths | % of deaths | Crude rate | ASMR† | ASMR 95% CI | |
| All cancers | 29,074 | 100.0% | 208.0 | 190.0 | 187.8 - 192.2 | 15,136 | 100.0% | 220.4 | 224.4 | 220.8 - 228.0 | 13,938 | 100.0% | 196.1 | 165.5 | 162.8 - 168.3 |
| Bladder | 876 | 3.0% | 6.3 | 5.6 | 5.3 - 6.0 | 626 | 4.1% | 9.1 | 9.6 | 8.9 - 10.4 | 250 | 1.8% | 3.5 | 2.8 | 2.4 - 3.1 |
| Brain | 838 | 2.9% | 6.0 | 5.6 | 5.3 - 6.0 | 480 | 3.2% | 7.0 | 6.9 | 6.3 - 7.6 | 358 | 2.6% | 5.0 | 4.5 | 4.1 - 5.0 |
| Breast (female) | 2,039 | 7.0% | 28.7 | 24.9 | 23.8 - 26.0 | n/a | n/a | n/a | n/a | n/a | 2,039 | 14.6% | 28.7 | 24.9 | 23.8 - 26.0 |
| Cervix | 172 | 0.6% | 2.4 | 2.3 | 1.9 - 2.6 | n/a | n/a | n/a | n/a | n/a | 172 | 1.2% | 2.4 | 2.3 | 1.9 - 2.6 |
| Colorectal | 3,124 | 10.7% | 22.4 | 20.3 | 19.6 - 21.1 | 1,670 | 11.0% | 24.3 | 25.0 | 23.8 - 26.2 | 1,454 | 10.4% | 20.5 | 16.6 | 15.8 - 17.5 |
| Esophagus | 779 | 2.7% | 5.6 | 5.1 | 4.7 - 5.4 | 595 | 3.9% | 8.7 | 8.5 | 7.9 - 9.3 | 184 | 1.3% | 2.6 | 2.1 | 1.8 - 2.5 |
| Hodgkin lymphoma | 43 | 0.1% | 0.3 | 0.3 | 0.2 - 0.4 | 31 | 0.2% | 0.5 | 0.5 | 0.3 - 0.6 | 12 | 0.1% | 0.2 | 0.1 | 0.1 - 0.2 |
| Kidney | 573 | 2.0% | 4.1 | 3.7 | 3.4 - 4.1 | 365 | 2.4% | 5.3 | 5.4 | 4.8 - 6.0 | 208 | 1.5% | 2.9 | 2.4 | 2.1 - 2.8 |
| Larynx | 127 | 0.4% | 0.9 | 0.8 | 0.7 - 1.0 | 99 | 0.7% | 1.4 | 1.4 | 1.2 - 1.7 | 28 | 0.2% | 0.4 | 0.3 | 0.2 - 0.5 |
| Leukemia | 1,095 | 3.8% | 7.8 | 7.2 | 6.8 - 7.6 | 633 | 4.2% | 9.2 | 9.4 | 8.7 - 10.2 | 462 | 3.3% | 6.5 | 5.5 | 5.0 - 6.0 |
| Liver | 1,161 | 4.0% | 8.3 | 7.6 | 7.2 - 8.1 | 747 | 4.9% | 10.9 | 10.9 | 10.1 - 11.7 | 414 | 3.0% | 5.8 | 4.9 | 4.4 - 5.4 |
| Lung | 6,794 | 23.4% | 48.6 | 44.2 | 43.2 - 45.3 | 3,494 | 23.1% | 50.9 | 50.8 | 49.2 - 52.6 | 3,300 | 23.7% | 46.4 | 39.3 | 38.0 - 40.7 |
| Melanoma | 512 | 1.8% | 3.7 | 3.4 | 3.1 - 3.7 | 337 | 2.2% | 4.9 | 5.0 | 4.5 - 5.6 | 175 | 1.3% | 2.5 | 2.1 | 1.8 - 2.5 |
| Myeloma | 568 | 2.0% | 4.1 | 3.7 | 3.4 - 4.0 | 311 | 2.1% | 4.5 | 4.6 | 4.1 - 5.1 | 257 | 1.8% | 3.6 | 3.0 | 2.7 - 3.4 |
| Non-Hodgkin lymphoma | 1,007 | 3.5% | 7.2 | 6.6 | 6.2 - 7.0 | 539 | 3.6% | 7.8 | 8.0 | 7.3 - 8.7 | 468 | 3.4% | 6.6 | 5.5 | 5.0 - 6.0 |
| Oral cavity & pharynx | 548 | 1.9% | 3.9 | 3.6 | 3.3 - 3.9 | 374 | 2.5% | 5.4 | 5.4 | 4.8 - 6.0 | 174 | 1.2% | 2.4 | 2.0 | 1.7 - 2.4 |
| Ovary | 675 | 2.3% | 9.5 | 8.3 | 7.7 - 8.9 | n/a | n/a | n/a | n/a | n/a | 675 | 4.8% | 9.5 | 8.3 | 7.7 - 8.9 |
| Pancreas | 1,880 | 6.5% | 13.5 | 12.3 | 11.7 - 12.8 | 994 | 6.6% | 14.5 | 14.5 | 13.6 - 15.4 | 886 | 6.4% | 12.5 | 10.4 | 9.7 - 11.1 |
| Prostate | 1,568 | 5.4% | 22.8 | 24.4 | 23.2 - 25.7 | 1,568 | 10.4% | 22.8 | 24.4 | 23.2 - 25.7 | n/a | n/a | n/a | n/a | n/a |
| Stomach | 764 | 2.6% | 5.5 | 5.0 | 4.7 - 5.4 | 487 | 3.2% | 7.1 | 7.2 | 6.6 - 7.9 | 277 | 2.0% | 3.9 | 3.3 | 3.0 - 3.8 |
| Testis | 15 | 0.1% | 0.2 | 0.2 | 0.1 - 0.4 | 15 | 0.1% | 0.2 | 0.2 | 0.1 - 0.4 | n/a | n/a | n/a | n/a | n/a |
| Thyroid | 93 | 0.3% | 0.7 | 0.6 | 0.5 - 0.8 | 39 | 0.3% | 0.6 | 0.6 | 0.4 - 0.8 | 54 | 0.4% | 0.8 | 0.6 | 0.5 - 0.8 |
| Uterus | 494 | 1.7% | 7.0 | 6.0 | 5.5 - 6.5 | n/a | n/a | n/a | n/a | n/a | 494 | 3.5% | 7.0 | 6.0 | 5.5 - 6.5 |
Abbreviations: ASMR means age-standardized mortality rate; CI means confidence interval.
Symbol: †Rates standardized to the 2011 Canadian population.
Note: Rates are per 100,000.
Analysis by: Surveillance, Analytics and Informatics, Ontario Health (Cancer Care Ontario)
Data source: Ontario Cancer Registry (December 2018), Ontario Health (Cancer Care Ontario)
Mortality by Age
Between 2014 and 2016, the median[*] age at death for all cancers was 74 years for both males and females (Table 6.3). The median age at death varied by cancer type. Cancers with the lowest median age at death (under 60 years) were testicular and cervical. The median age for most other cancer types were above age 70.
In 2016, the median age of cancer death was 74 years.
| Cancer type | Age (years) | ||
|---|---|---|---|
| Both sexes | Males | Females | |
| All cancers | 74 | 74 | 74 |
| Bladder | 81 | 80 | 82 |
| Brain | 65 | 64 | 67 |
| Breast (female) | 71 | n/a | 71 |
| Cervix | 59 | n/a | 59 |
| Colorectal | 77 | 75 | 79 |
| Esophagus | 71 | 70 | 74 |
| Hodgkin lymphoma | 72 | 69 | 75 |
| Kidney | 74 | 72 | 78 |
| Larynx | 74 | 73 | 76 |
| Leukemia | 76 | 76 | 77 |
| Liver | 72 | 70 | 74 |
| Lung | 73 | 73 | 73 |
| Melanoma | 73 | 73 | 72 |
| Myeloma | 76 | 75 | 77 |
| Non-Hodgkin lymphoma | 76 | 74 | 77 |
| Oral cavity & pharynx | 69 | 67 | 73 |
| Ovary | 71 | 57 | 71 |
| Pancreas | 73 | 71 | 76 |
| Prostate | 82 | 82 | n/a |
| Stomach | 73 | 73 | 75 |
| Testis | 39 | 39 | n/a |
| Thyroid | 74 | 73 | 76 |
| Uterus | 71 | n/a | 71 |
Analysis by: Surveillance, Analytics and Informatics, Ontario Health (Cancer Care Ontario)
Data source: Ontario Cancer Registry (December 2018), Ontario Health (Cancer Care Ontario)
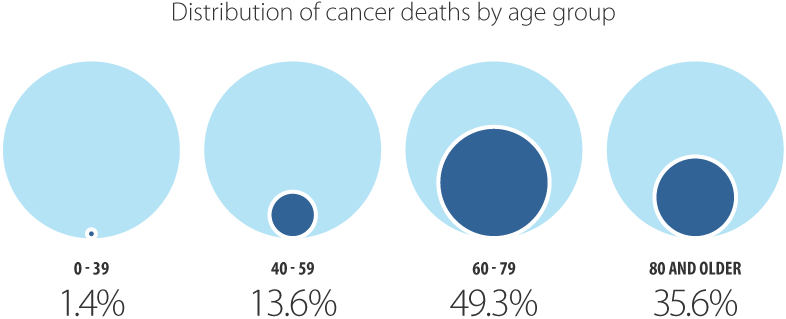
In 2016, 85% of all people in Ontario who died of cancer were 60 years of age or older (Table 6.4). Mortality was distributed differently by age group.
Ages 0 to 39
People younger than 40 years of age made up 1.4% of all cancer deaths (compared with 5.0% of all new cases), with brain cancer and leukemia as the leading causes.
In 2016, 0.3% of all cancer deaths occurred in individuals diagnosed with cancer as children (0 to 14 years of age). From 2012 to 2016, the majority of deaths in individuals diagnosed with cancer as children occurred in those with:
- CNS and miscellaneous intracranial and intraspinal neoplasms (35.8%)
- leukemias, myeloproliferative diseases and myelodysplastic diseases (24.4%)
For more information, please visit the POGO Surveillance Report.
Ages 40 to 59
People 40 to 59 years of age made up 13.6% of all cancer deaths (compared with 23.5% of all new cases), with breast and lung cancers as the leading causes.
Ages 60 to 79
People 60 to 79 years of age made up 49.3% of all cancer deaths (compared with 52.1% of all new cases).
This age group represented the greatest proportion of cancer deaths for 19 of the 23 types of cancer examined. The greatest proportions of deaths were from breast (43.5%) and lung (58.6%) cancers in this age group.
Ages 80 and older
People 80 years of age or older made up 35.6% of all cancer deaths (compared with 18.9% of all new cases), with lung and colorectal cancers as the leading causes.
While prostate cancer was diagnosed most frequently in males ages 60 to 79, most deaths caused by prostate cancer were in males 80 years or older. This reflects both the often slow progression of the disease and the higher frequency of later stage cancers in older males.
Cancer mortality increased significantly with age – from a rate of 6.1 per 100,000 in people age 39 or younger, to a rate of 1,719.0 per 100,000 in people age 80 or older (Table 6.4). Mortality varied by cancer type:
- Significant increases with age for cancers of the bladder, breast, colorectal, kidney, pancreas, stomach and thyroid, as well as leukemia, melanoma, myeloma, Hodgkin lymphoma and non-Hodgkin lymphoma.
- Non-significant increases with age for cancers of the brain, cervix, esophagus, larynx, liver, lung, oral cavity & pharynx, ovary, prostate and uterus.
- Testicular cancer was highest in those ages 40 to 59.
| Cancer type | Ages 0 - 39 years | Ages 40 - 59 years | Ages 60 - 79 years | Ages 80 years or older | ||||||||
|---|---|---|---|---|---|---|---|---|---|---|---|---|
| Deaths | Age-specific rate | 95 % CI | Deaths | Age-specific rate | 95 % CI | Deaths | Age-specific rate | 95 % CI | Deaths | Age-specific rate | 95 % CI | |
| All cancers* | 421 | 6.1 | 5.6 - 6.7 | 3,958 | 100.1 | 97.0 - 103.3 | 14,335 | 562.2 | 553.0 - 571.4 | 10,360 | 1719.0 | 1,686.1 - 1,752.5 |
| Bladder* | ** | ** | ** | 52 | 1.3 | 1.0 - 1.7 | 348 | 13.6 | 12.3 - 15.2 | 473 | 78.5 | 71.6 - 85.9 |
| Brain | 50 | 0.7 | 0.5 - 1.0 | 231 | 5.8 | 5.1 - 6.6 | 416 | 16.3 | 14.8 - 18.0 | 141 | 23.4 | 19.7 - 27.6 |
| Breast (female)* | 50 | 1.5 | 1.1 - 1.9 | 464 | 23.2 | 21.2 - 25.4 | 887 | 66.3 | 62.0 - 70.8 | 638 | 174.1 | 160.9 - 188.2 |
| Cervix | 17 | 0.5 | 0.3 - 0.8 | 68 | 3.4 | 2.6 - 4.3 | 52 | 3.9 | 2.9 - 5.1 | 35 | 9.6 | 6.7 - 13.3 |
| Colorectal* | 38 | 0.6 | 0.4 - 0.8 | 397 | 10.0 | 9.1 - 11.1 | 1,336 | 52.4 | 49.6 - 55.3 | 1,353 | 224.5 | 212.7 - 236.8 |
| Esophagus | 11 | 0.2 | 0.1 - 0.3 | 131 | 3.3 | 2.8 - 3.9 | 446 | 17.5 | 15.9 - 19.2 | 191 | 31.7 | 27.4 - 36.5 |
| Hodgkin lymphoma* | ** | ** | ** | ** | ** | ** | 23 | 0.9 | 0.6 - 1.4 | 12 | 2.0 | 1.0 - 3.5 |
| Kidney* | 7 | 0.1 | 0.0 - 0.2 | 65 | 1.6 | 1.3 - 2.1 | 284 | 11.1 | 9.9 - 12.5 | 217 | 36.0 | 31.4 - 41.1 |
| Larynx | 0 | 0.0 | 0.0 - 0.1 | 15 | 0.4 | 0.2 - 0.6 | 80 | 3.1 | 2.5 - 3.9 | 32 | 5.3 | 3.6 - 7.5 |
| Leukemia* | 53 | 0.8 | 0.6 - 1.0 | 110 | 2.8 | 2.3 - 3.4 | 498 | 19.5 | 17.9 - 21.3 | 434 | 72.0 | 65.4 - 79.1 |
| Liver | 13 | 0.2 | 0.1 - 0.3 | 181 | 4.6 | 3.9 - 5.3 | 639 | 25.1 | 23.2 - 27.1 | 328 | 54.4 | 48.7 - 60.6 |
| Lung | 12 | 0.2 | 0.1 - 0.3 | 796 | 20.1 | 18.8 - 21.6 | 3,978 | 156.0 | 151.2 - 160.9 | 2,008 | 333.2 | 318.8 - 348.1 |
| Melanoma* | 12 | 0.2 | 0.1 - 0.3 | 84 | 2.1 | 1.7 - 2.6 | 243 | 9.5 | 8.4 - 10.8 | 173 | 28.7 | 24.6 - 33.3 |
| Myeloma* | ** | ** | ** | 50† | 1.3 | 0.9 - 1.7 | 296 | 11.6 | 10.3 - 13.0 | 219 | 36.3 | 31.7 - 41.5 |
| Non-Hodgkin lymphoma* | 20 | 0.3 | 0.2 - 0.4 | 117 | 3.0 | 2.4 - 3.5 | 486 | 19.1 | 17.4 - 20.8 | 384 | 63.7 | 57.5 - 70.4 |
| Oral cavity and pharynx | ** | ** | ** | 110† | 2.8 | 2.3 - 3.3 | 290 | 11.4 | 10.1 - 12.8 | 147 | 24.4 | 20.6 - 28.7 |
| Ovary | 13 | 0.4 | 0.2 - 0.7 | 136 | 6.8 | 5.7 - 8.1 | 359 | 26.8 | 24.1 - 29.8 | 167 | 45.6 | 38.9 - 53.0 |
| Pancreas* | 6 | 0.1 | 0.0 - 0.2 | 272 | 6.9 | 6.1 - 7.7 | 987 | 38.7 | 36.3 - 41.2 | 615 | 102.0 | 94.1 - 110.4 |
| Prostate | ** | ** | ** | 50† | 2.5 | 1.9 - 3.4 | 582 | 48.0 | 44.2 - 52.1 | 934 | 395.3 | 370.4 - 421.5 |
| Stomach* | 15 | 0.2 | 0.1 - 0.4 | 127 | 3.2 | 2.7 - 3.8 | 369 | 14.5 | 13.0 - 16.0 | 253 | 42.0 | 37.0 - 47.5 |
| Testis | 6 | 0.2 | 0.1 - 0.4 | 7 | 0.4 | 0.1 - 0.7 | ** | ** | ** | ** | ** | ** |
| Thyroid* | ** | ** | ** | 20† | 0.5 | 0.3 - 0.8 | 37 | 1.5 | 1.0 - 2.0 | 35 | 5.8 | 4.0 - 8.1 |
| Uterus | ** | ** | ** | 85† | 4.2 | 3.4 - 5.2 | 258 | 19.3 | 17.0 - 21.8 | 147 | 40.1 | 33.9 - 47.2 |
Abbreviation: CI means confidence interval.
Symbols:
- *Significant increasing trend in age-specific rate with increasing age.
- **Suppressed due to small case count (count less than 6).
- †Count has been rounded to ensure confidentiality; associated rate and confidence interval have been adjusted to reflect rounded count
Notes:
- Rates are per 100,000.
- Excludes cases of unknown age.
Analysis by: Surveillance, Analytics and Informatics, Ontario Health (Cancer Care Ontario)
Data source: Ontario Cancer Registry (December 2018), Ontario Health (Cancer Care Ontario)
Mortality Trends by Cancer Type
The cancer mortality rate for all cancers combined in Ontario has been decreasing over the past few decades, with the decline accelerating in recent years. Between 1985 and 2001, the age-standardized mortality rate (ASMR) decreased by 0.5% per year and fell a further 1.6% per year between 2001 and 2016 (Table 6.5).
Generally, the declines in mortality have been greater for males than females. For males, the mortality rate declined by 1.0% per year between 1988 and 2002, and then by 1.9% per year between 2002 and 2016. For females, the rate declined by 0.3% per year between 1985 and 2002, and then declined by 1.4% per year between 2002 and 2016. The following section examines some of the reasons for these changes.
Recent mortality trends for the 4 most common cancers
Prostate cancer
The prostate cancer ASMR decreased by 2.9% per year from 1994 to 2016 (Table 6.5). This decline is likely due to early detection, which decreased incidence, and to improved treatments -that increased survival from prostate cancer.
Breast cancer
The ASMR for breast cancer decreased by 2.4% per year from 1994 to 2016 (Table 6.5). This is likely because of:
- greater regular participation in mammography screening, especially after the introduction of Ontario’s organized breast screening program[5,6]
- improved primary treatment[7,8]
- the use of more effective chemotherapies following breast cancer surgery[7,8]
Colorectal cancer
The colorectal cancer ASMR has consistently declined in both sexes since 1981 (Table 6.5). In males, the mortality rate declined 3.4% per year from 2005 to 2016. The rate decreased similarly among females by 2.7% per year from 2004 onward.
Reasons for these strong declines may be changes in risk and protective factors, earlier diagnosis due to greater uptake of screening, and improvements in treatment.[9]
Lung cancer
In males, the ASMR for lung cancer declined by 2.2% per year from 1988 to 2012, followed by a steeper decline of 4.2% from 2012 onward (Table 6.5). Among females, the mortality rate was stable from 1999 until 2008 then began a decrease of 1.4% per year onward.
Decreases in lung cancer mortality are largely attributable to decreased tobacco use, which began to decline in the late 1950s for males and in the mid-1970s for females.[4,10] This approximately 15-year gap in peak smoking rates between males and females corresponds to the gap in the stabilization of lung cancer mortality rates between the sexes.
Notable changes in trend for other cancers
Liver cancer
The liver cancer ASMR has been increasing at 2.4% per year from 1994 onward, following a previous rapid upward trend in the mortality rate (Table 6.5). This increase was probably at least partially because of the rise in the incidence rate over the same period.
Ovarian cancer
The ASMR for ovarian cancer was stable from 2003 to 2007 followed by a significant decline of 1.0% per year from 2007 onward (Table 6.5). This parallels the decrease in the ovarian cancer incidence rate since 2002.
Declines in ovarian cancer incidence and mortality likely result from changes in exposure to risk and protective factors, including the increasing use of oral contraceptives.[11] Declines in mortality may also reflect increasing survival due to improvements in treatment.[12]
Stomach cancer
The stomach cancer ASMR decreased by 3.6% per year until 1993, then by 2.3% per year from 1993 onward (Table 6.5).
Reasons for this decline include decreased exposure to Helicobacter pylori (H.pylori) infection, improvements in food preservation and refrigeration, lifestyle changes, and better treatment.[13]
| Cancer type | Both sexes | |
|---|---|---|
| Period | APC (%) | |
| All cancers | 1981 - 1985 | 1.1* |
| 1985 - 2001 | -0.5* | |
| 2001 - 2016 | -1.6* | |
| Bladder | 1981 - 1996 | -1.6* |
| 1996 - 2000 | 2.6 | |
| 2000 - 2016 | -0.8* | |
| Brain | 1981 - 2006 | -1.0* |
| 2006 - 2010 | 4.3 | |
| 2010 - 2016 | -0.6 | |
| Breast (female) | n/a | n/a |
| n/a | n/a | |
| n/a | n/a | |
| Cervix | n/a | n/a |
| n/a | n/a | |
| Colorectal | 1981 - 2004 | -1.4* |
| 2004 - 2016 | -3.0* | |
| Esophagus | 1981 - 2000 | 0.7* |
| 2000 - 2016 | -0.8* | |
| Hodgkin lymphoma | 1981 - 1990 | -6.7* |
| 1990 - 2016 | -2.9* | |
| Kidney | 1981 - 2008 | 0.0 |
| 2008 - 2016 | -1.9* | |
| Larynx | 1981 - 2000 | -1.3* |
| 2000 - 2016 | -4.7* | |
| Leukemia | 1981 - 2016 | -0.8* |
| Liver | 1981 - 1994 | 4.2* |
| 1994 - 2016 | 2.4* | |
| Lung | 1981 - 1988 | 1.7* |
| 1988 - 2010 | -0.9* | |
| 2010 - 2016 | -2.8* | |
| Melanoma | 1981 - 2016 | 0.9* |
| Myeloma | 1981 - 1999 | 0.5 |
| 1999 - 2016 | -1.4* | |
| Non-Hodgkin lymphoma | 1981 - 1999 | 2.0* |
| 1999 - 2016 | -2.1* | |
| Oral cavity & pharynx | 1981 - 2009 | -1.8* |
| 2009 - 2016 | 1.7 | |
| Ovary | n/a | n/a |
| Pancreas | 1981 - 2006 | -0.7* |
| 2006 - 2016 | 0.8* | |
| Prostate | n/a | n/a |
| Stomach | 1981 - 1993 | -3.6* |
| 1993 - 2016 | -2.3* | |
| Testis | n/a | n/a |
| Thyroid | 1981 - 2016 | -0.3 |
| Uterus | n/a | n/a |
| Cancer type | Males | |
|---|---|---|
| Period | APC (%) | |
| All cancers | 1981 - 1988 | 0.5* |
| 1988 - 2002 | -1.0* | |
| 2002 - 2016 | -1.9* | |
| Bladder | 1981 - 2016 | -0.7* |
| Brain | 1981 - 1997 | -1.5* |
| 1997 - 2016 | 0.6* | |
| Breast (female) | n/a | n/a |
| Cervix | n/a | n/a |
| Colorectal | 1981 - 2005 | -1.3* |
| 2005 - 2016 | -3.4* | |
| Esophagus | 1981 - 2009 | 0.4* |
| 2009 - 2016 | -1.9 | |
| Hodgkin lymphoma | 1981 - 1990 | -7.9* |
| 1990 - 2016 | -2.9* | |
| Kidney | 1981 - 2006 | 0.1 |
| 2006 - 2016 | -1.5* | |
| Larynx | 1981 - 2001 | -1.4* |
| 2001 - 2016 | -5.2* | |
| Leukemia | 1981 - 1996 | 0.0 |
| 1996 - 2016 | -1.3* | |
| Liver | 1981 - 1995 | 4.7* |
| 1995 - 2016 | 2.2* | |
| Lung | 1981 - 1988 | 0.4 |
| 1988 - 2012 | -2.2* | |
| 2012 - 2016 | -4.2* | |
| Melanoma | 1981 - 2016 | 1.2* |
| Myeloma | 1981 - 1996 | 0.6 |
| 1996 - 2016 | -1.1* | |
| Non-Hodgkin lymphoma | 1981 - 2000 | 1.9* |
| 2000 - 2016 | -2.1* | |
| Oral cavity & pharynx | 1981 - 2008 | -2.2* |
| 2008 - 2016 | 1.7 | |
| Ovary | n/a | n/a |
| Pancreas | 1981 - 2005 | -1.2* |
| 2005 - 2016 | 1.0* | |
| Prostate | 1981 - 1994 | 1.7* |
| 1994 - 2016 | -2.9* | |
| Stomach | 1981 - 2016 | -2.8* |
| Testis | 1981 - 2016 | -2.9* |
| Thyroid | 1981 - 2016 | 0.8* |
| Uterus | n/a | n/a |
| Cancer type | Females | |
|---|---|---|
| Period | APC (%) | |
| All cancers | 1981 - 1985 | 1.0 |
| 1985 - 2002 | -0.3* | |
| 2002 - 2016 | -1.4* | |
| Bladder | 1981 - 1997 | -1.5* |
| 1997 - 2004 | 2.3 | |
| 2004 - 2016 | -1.9* | |
| Brain | 1981 - 2006 | -1.0* |
| 2006 - 2016 | 2.0* | |
| Breast (female) | 1981 - 1986 | 1.3 |
| 1986 - 1994 | -1.0* | |
| 1994 - 2016 | -2.4* | |
| Cervix | 1981 - 2002 | -3.5* |
| 2002 - 2016 | -1.4* | |
| Colorectal | 1981 - 2004 | -1.8* |
| 2004 - 2016 | -2.7* | |
| Esophagus | 1981 - 1995 | 0.6 |
| 1995 - 2016 | -1.4* | |
| Hodgkin lymphoma | 1981 - 2016 | -3.3* |
| Kidney | 1981 - 2010 | -0.2 |
| 2010 - 2016 | -3.5* | |
| Larynx | 1981 - 2016 | -2.7* |
| Leukemia | 1981 - 2016 | -0.9* |
| Liver | 1981 - 2016 | 2.6* |
| Lung | 1981 - 1985 | 7.4* |
| 1985 - 1999 | 1.9* | |
| 1999 - 2008 | 0.1 | |
| 2008 - 2016 | -1.4* | |
| Melanoma | 1981 - 2016 | 0.4* |
| Myeloma | 1981 - 1999 | 0.6 |
| 1999 - 2016 | -1.9* | |
| Non-Hodgkin lymphoma | 1981 - 1998 | 2.1* |
| 1998 - 2016 | -2.2* | |
| Oral cavity & pharynx | 1981 - 2016 | -1.3* |
| Ovary | 1981 - 1999 | -0.8* |
| 1999 - 2003 | 2.2 | |
| 2003 - 2007 | -4.7 | |
| 2007 - 2016 | -1.0* | |
| Pancreas | 1981 - 2016 | -0.1 |
| Prostate | n/a | n/a |
| Stomach | 1981 - 1993 | -4.2* |
| 1993 - 2016 | -2.0* | |
| Testis | n/a | n/a |
| Thyroid | 1981 - 2016 | -0.8* |
| Uterus | 1981 - 1993 | -1.8* |
| 1993 - 2016 | 1.2* | |
Abbreviation: APC means annual percent change
Notes:
- Statistically significant changes in trend and their direction are indicated by corresponding arrows.
- Rates are standardized to the 2011 Canadian population.
Analysis by: Surveillance, Analytics and Informatics, Ontario Health (Cancer Care Ontario)
Data source: Ontario Cancer Registry (December 2018), Ontario Health (Cancer Care Ontario)
Thirty-Five Year Trend in Mortality
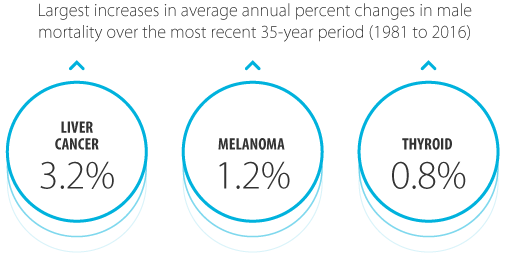
Over the most recent 35-year period of 1981 to 2016, the average annual percent change (AAPC) in the age-standardized mortality rate (ASMR) for males (Figure 6.3):
- decreased for most types of cancer, including Hodgkin lymphoma (4.2% per year), laryngeal cancer (3.1%) and testicular cancer (2.9%)
- increased for liver cancer (3.2%), melanoma (1.2%) and thyroid cancer (0.8% per year)
- was stable for brain, kidney and esophageal cancers, as well as myeloma and non-Hodgkin lymphoma
Over the same period, the AAPC in the ASMR for females:
- decreased for most types of cancer, including Hodgkin lymphoma (3.3% per year), and cervical (2.7%) and laryngeal (2.7%) cancers
- increased for liver (2.6%) and lung (1.3%) cancers, and melanoma (0.4%)
- was stable for pancreatic, brain and uterine cancers, and non-Hodgkin lymphoma
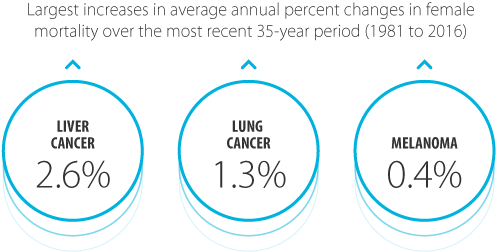
For some cancers, such as liver cancer and melanoma, the increases in mortality rates likely reflect increases in incidence rates.
The ASMR for the 1981 to 2016 period for bladder, breast, colorectal, liver, lung, melanoma, pancreatic and prostate cancers are shown in Figure 6.4. These cancers represent the 4 most common cancers plus those with an important trend in mortality.
Mortality Trends by Age
Mortality rates across all age groups have been declining significantly over the last decade. In younger people, they have declined fairly equally between the sexes. However, among people age 60 or older, the declines in mortality have been greater among males (Figure 6.5).
Ages 0 to 39
While incidence rates have been increasing among younger people, mortality rates have been stable or decreasing. Among males under 40, the mortality rate declined by 1.7% per year between 1981 and 1991. Among females in this age group, mortality rates declined by 1.9% per year between 1981 and 2007, and have been stable from 2007 onward.
Age-standardized mortality rates (ASMR) among individuals diagnosed with cancer as children (0 to 14 years of age) have been stable over the period between 1991 and 2016 (see Spotlight: Childhood Cancer Mortality Trend, Figure 6.S1).
For details about childhood cancer mortality trends, visit the POGO Surveillance Report.
Spotlight: Childhood Cancer Mortality Trend
Ages 40 to 59
For people ages 40 to 59, the mortality rate was stable until 1987, when it started to decline by 2.1% per year until 2016. Similar trends were seen for males and females as separate groups.
Ages 60 to 79
Among those ages 60 to 79, the mortality rate increased until 1988, after which it decreased by 0.8% per year until 2002. Between 2002 and 2016, the rate decreased by 2.0% per year. The rate of decrease has been greater for males (2.4% per year) than females (1.7% per year).
Ages 80 and older
Similar to people ages 60 to 79, mortality among those 80 or older increased by 0.5% per year between 1981 and 2002, followed by a decrease of 0.7% per year between 2002 and 2016. The decline in mortality has been greater for males, at 1.2% per year after 2001. Among females, the mortality rate was stable between 1997 and 2001, after which it decreased by 0.7% per year.