
Ontario Cancer Statistics 2020 Ch 4: Burden of Rare Cancers in Ontario
Rare cancers differ from common cancers, but they are not well understood. This chapter focuses on adult cancers with fewer than 6 cases per 100,000 people each year.
What's on this page
A lack of information exists on rare cancers in adults in Ontario and, more generally, in Canada, even though they are a considerable public health issue.[1,2]
Rare cancers differ from common cancers in several ways:
- The lack of familiarity with these cancers by healthcare providers can lead to delays in diagnosis. Studies have found delays in the time from the appearance of the first symptoms of a rare cancer to the time of diagnosis.
- The lack of treatment options for rare cancers can mean poorer outcomes for patients.
- Healthcare providers do not adequately understand rare cancers and their treatment because funding and research are limited, and the low number of patients makes clinical trials difficult to conduct.
- Support services and information for people with a rare cancer is often unavailable or limited, which contributes to patients feeling alienated, confused and stressed.
Rare cancers are defined in this report as cancers with fewer than 6 cases per 100,000 people per year, based on the most widely used definition created by the RARECARE consortium from the European Union.[3] RARECAREnet, which represents a recent update of the original RARECARE statistics, considers a long list of 198 rare cancers categorized into 63 groups.
To simplify the examination of rare cancers, this report uses several criteria to modify the RARECAREnet list of cancers. See Inclusion and Exclusion Criteria for details.
Rare Cancers Versus Common Cancers
Incidence and mortality
This section examines the overall incidence and mortality of all cancers in Ontario meeting the definition of less than 6 cases per 100,000 per year.
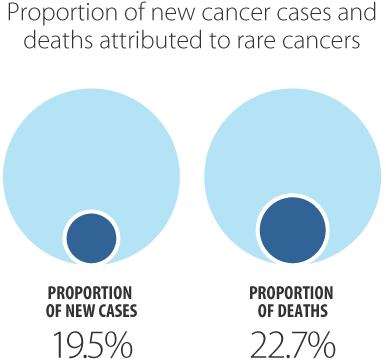
Rare cancers accounted for about 20% of all new cancer cases diagnosed between 2012 and 2016, and about 23% of all cancer deaths in Ontario (Figure 4.1).
- Among males, rare cancers accounted for 23% of new cases and about 25% of deaths.
- Among females, rare cancers accounted for about 16% of new cases and 20% of deaths.
Rare cancers tend to have a genetic component, which may explain why they occur more often among younger people.
Using a comparable definition for a rare cancer but not accounting for histological types, the proportion of new cases considered rare was higher in Ontario than in the U.S., where 13% of cancers diagnosed in adults 20 and older were considered rare in 2017.[4] An analysis in England found that rare cancers contribute to nearly half of all new cases (47%).[5]
Differences in the frequency of rare cancers reported in other jurisdictions may occur because they use different methodologies. Jurisdictions that include rare histological subtypes of common cancers in their definitions of a rare cancer had a higher percentage of cases considered rare. For example, these include an earlier study in the U.S. in which 20% were considered rare,[6] 22% in Europe,[3] and 25% in Italy.[8] In addition, these numbers include cancers diagnosed at all ages, so would be expected to be slightly higher, as rare cancers are more common in younger people (see Figure 4.2). In other cases, the proportion can be lower, despite using a detailed definition aligned with RARECAREnet and considering all ages, such as in Japan where 15% of cancer cases were considered rare.[7]
Rare cancers tend to have a genetic component, which may explain why they occur more often among younger people.
People diagnosed with rare cancers were almost 3 times more likely to be in the 15 to 39 year age group than those diagnosed with a common cancer (Figure 4.2). A greater percentage of common cancers occurred in those ages 60 to 79 (52.2%) compared with rare cancers (44.4%). Similar results have been found in other jurisdictions.[8,9] Rare cancers tend to have a genetic component, which may explain why they occur more often among younger people as they may present earlier than cancers more strongly associated with aging.[9]
Rare cancers in those ages 15 to 39 years represented nearly double the proportion of cancer deaths (2.0% versus 1.1%) compared with common cancers in the same age group (Figure 4.3). The proportions were generally similar in all other age groups, with slightly fewer deaths in those 60 to 79, and slightly more deaths in those 80 years and older compared with people who had common cancers.
Mortality by age
Survival
Survival statistics are a key indicator of prognosis, the effectiveness of control programs and cancer treatment. Relative survival ratios (RSRs) indicate the likelihood of a person surviving for a certain amount of time (e.g., 5 years) after diagnosis compared with similar people (i.e., people of the same age and sex) in the general population. See Chapter 7: Cancer Survival for more details.
Five-year relative survival was significantly lower for rare cancers (56.6%) than for the common cancers (68.8%) (Figure 4.4). This may be because rare cancers have fewer and less effective treatment options and are more likely to have a delayed diagnosis.[8] In contrast, higher survival for common cancers reflects several factors that, together, can lead to better outcomes:
- More familiarity among oncologists with the treatment for these cancers
- Availability of more treatment options
- More funding for research
- Availability of screening tests for some cancers
- Greater advocacy and patient support
Five-year relative survival was significantly lower for rare cancers (56.6%) than for the common cancers (68.8%).
Five-year relative survival for rare cancers was similar to that reported in Europe (47%)[3] and Italy (55%).[8]
Survival by sex
Among rare cancers, there was no significant difference in survival between the sexes (Figure 4.4). However, compared with survival for common cancers, the 5-year survival for rare cancers in Ontario was 11.0 percentage points less among males, but 19.2 percentage points less among females. This is similar to findings for rare cancers in the U.S.[6]
Lower survival among rare cancers may be due to differences in stage at diagnosis. One study found that rare cancers were more often diagnosed at later stages than common cancers.[6] This has been attributed to their less frequent occurrence, which may mean they are not considered as a diagnosis when investigating symptoms.[6,10] In addition, rare cancers often lack effective treatment options, which may result in lower survival.[3,11]
For some cancers, such as those more common among adolescents and young adults, differences in survival might also be due to differences in tumour biology.[12]
Survival by age
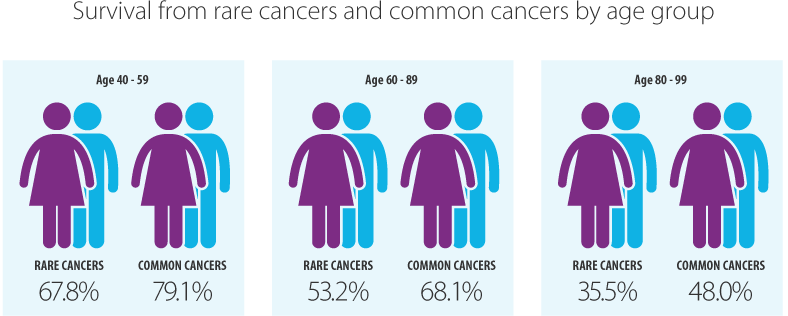
There was no significant difference between rare and common cancer survival in those ages 15 to 39 (Figure 4.5). Differences in survival only appeared in older age groups, with the difference generally increasing as age increased.
Those with a rare cancer diagnosed between 40 and 59 years had a 5-year relative survival ratio of 11.3 percentage points lower than those with a common cancer. The survival difference increased to 14.9 percentage points for those between 60 and 79 years, and 20.4 percentage points for the 80 to 99 year age group. The lack of difference in survival in the youngest age group may reflect the fact that most cancers in older adolescents and young adults (e.g., testicular) are rare, and they are more likely to have effective treatments available than the rare cancers prevalent in older adults (e.g., mesothelioma).[13,14]
Prevalence
Cancer prevalence reflects the increase, decrease or stability of cancer incidence and mortality rates in the population. Therefore, it can help decide how to distribute diagnostic, treatment and care resources.
Cancer prevalence describes the number of people alive on a certain date – e.g., on January 1, 2017 – and who were diagnosed with cancer within a specified previous number of years (e.g., 2 years, 5 years, 10 years, 30 years). See Chapter 8: Cancer Prevalence for more details.
Prevalence counts presented here are based on the number of people diagnosed with cancer. Therefore, a person is counted only once, even if they have had more than 1 cancer diagnosis.
Rare cancers represent about 21% to 23% of all prevalent cases.
Because both incidence and survival are lower for rare cancers than for common cancers, prevalence is expected to be lower also. For all prevalence periods (i.e., 2, 5, and 10 years), rare cancers represent about 21% to 23% of all prevalent cases (Figure 4.6).
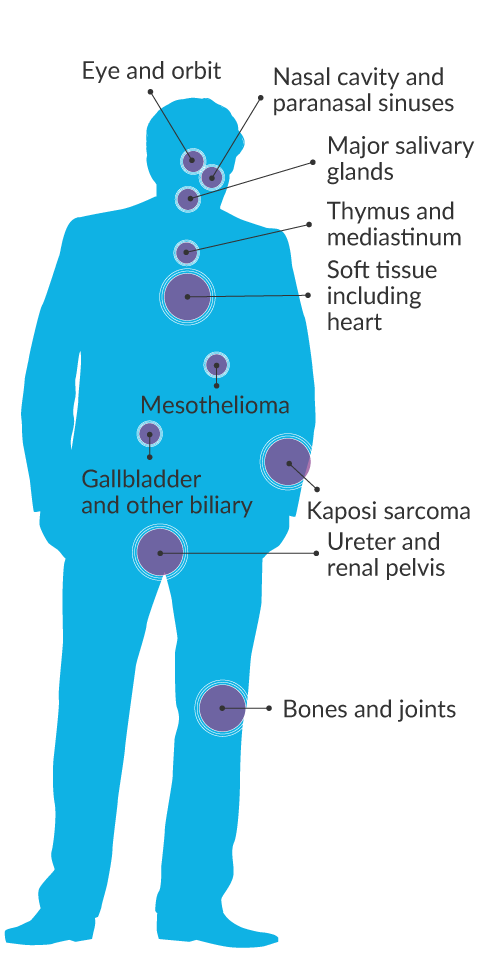
Incidence and Mortality of Selected Rare Cancers
This section examines a selected subset of rare cancers categorized by families (or major groupings) similar to RARECAREnet:
- Anus, anal canal and anorectum
- Appendix
- Bones and joints
- Breast (male)
- Eye and orbit
- Gallbladder and other biliary
- Kaposi sarcoma
- Major salivary glands
- Mesothelioma
- Middle ear
- Nasal cavity and paranasal sinuses
- Penis
- Peritoneum, Omentum and Mesentery
- Pleura
- Retroperitoneum
- Small intestine
- Soft tissue including heart
- Thymus and mediastinum
- Trachea
- Ureter and renal pelvis
- Vagina
- Vulva
Of the rare cancers examined, the most commonly diagnosed was the group of cancers of the gallbladder and other biliary organs (5.6 per 100,000). These accounted for less than 1% of all cancers diagnosed between 2012 and 2016 (Table 4.1).
Rare cancers with significantly higher age-standardized incidence rate (ASIR) in males than females.
- Bones and joints
- Eye and orbit
- Gallbladder and other biliary
- Kaposi sarcoma
- Major salivary glands
- Mesothelioma
- Nasal cavity and paranasal sinuses
- Soft tissue including heart
- Thymus and mediastinum
- Ureter and renal pelvis
Rare cancers with significantly higher age-standardized incidence rate (ASIR) in females than males.
- Anus, anal canal and anorectum
- Appendix

For both sexes combined as well as among females, cancers of soft tissue (including the heart) were the leading cause of rare cancer deaths, followed by gallbladder and other biliary organs. However, in males, mesothelioma was the leading cause of rare cancer death, followed by soft tissue sarcomas.
| Cancer type | New cases | % of all new cases | ASIR† | ASIR 95% CI | Deaths | % of all deaths | ASMR† | ASMR 95% CI |
|---|---|---|---|---|---|---|---|---|
| Both sexes | ||||||||
| Anus, anal canal and anorectum | 1,359 | 0.3% | 2.3 | 2.2 - 2.4 | 212 | 0.2% | 0.4 | 0.3 - 0.4 |
| Appendix | 1,200 | 0.3% | 2.1 | 2.0 - 2.2 | 155 | 0.1% | 0.3 | 0.2 - 0.3 |
| Bones and joints | 741 | 0.2% | 1.3 | 1.2 - 1.4 | 284 | 0.2% | 0.5 | 0.4 - 0.5 |
| Eye and orbit | 804 | 0.2% | 1.4 | 1.3 - 1.5 | 88 | 0.1% | 0.1 | 0.1 - 0.2 |
| Gallbladder and other biliary | 3,351 | 0.9% | 5.6 | 5.4 - 5.8 | 923 | 0.7% | 1.5 | 1.4 - 1.6 |
| Kaposi sarcoma | 232 | 0.1% | 0.4 | 0.3 - 0.4 | 13 | 0.0% | 0.0 | 0.0 - 0.0 |
| Major salivary glands | 1,222 | 0.3% | 2.1 | 1.9 - 2.2 | 235 | 0.2% | 0.4 | 0.3 - 0.4 |
| Mesothelioma | 1,147 | 0.3% | 1.9 | 1.8 - 2.0 | 816 | 0.6% | 1.3 | 1.3 - 1.4 |
| Middle ear | 14 | 0.0% | 0.0 | 0.0 - 0.0 | ** | ** | ** | ** |
| Nasal cavity and paranasal sinuses | 567 | 0.1% | 1.0 | 0.9 - 1.0 | 123 | 0.1% | 0.2 | 0.2 - 0.2 |
| Peritoneum, omentum and mesentery | 352 | 0.1% | 0.6 | 0.5 - 0.7 | 167 | 0.1% | 0.3 | 0.2 - 0.3 |
| Pleura | 60 | 0.0% | 0.1 | 0.1 - 0.1 | 13 | 0.0% | 0.0 | 0.0 - 0.0 |
| Retroperitoneum | 429 | 0.1% | 0.7 | 0.7 - 0.8 | 55 | 0.0% | 0.1 | 0.1 - 0.1 |
| Small intestine | 2,292 | 0.6% | 3.9 | 3.7 - 4.0 | 462 | 0.3% | 0.8 | 0.7 - 0.8 |
| Soft tissue including heart | 3,080 | 0.8% | 5.2 | 5.1 - 5.4 | 1,041 | 0.7% | 1.8 | 1.6 - 1.9 |
| Thymus and mediastinum | 410 | 0.1% | 0.7 | 0.6 - 0.8 | 27 | 0.0% | 0.0 | 0.0 - 0.1 |
| Trachea | 162 | 0.0% | 0.3 | 0.2 - 0.3 | 21 | 0.0% | 0.0 | 0.0 - 0.1 |
| Ureter and renal pelvis | 834 | 0.2% | 1.4 | 1.3 - 1.5 | 119 | 0.1% | 0.2 | 0.2 - 0.2 |
| Males | ||||||||
| Anus, anal canal and anorectum | 521 | 0.3% | 1.9 | 1.7 - 2.1 | 74 | 0.1% | 0.3 | 0.2 - 0.3 |
| Appendix | 510 | 0.3% | 1.8 | 1.7 - 2.0 | 64 | 0.1% | 0.2 | 0.2 - 0.3 |
| Bones and joints | 418 | 0.2% | 1.5 | 1.4 - 1.7 | 164 | 0.2% | 0.6 | 0.5 - 0.7 |
| Breast (male) | 437 | 0.2% | 1.6 | 1.5 - 1.8 | 80 | 0.1% | 0.3 | 0.2 - 0.4 |
| Eye and orbit | 440 | 0.2% | 1.6 | 1.4 - 1.8 | 43 | 0.1% | 0.2 | 0.1 - 0.2 |
| Gallbladder and other biliary | 1,670 | 0.9% | 6.2 | 5.9 - 6.5 | 381 | 0.5% | 1.5 | 1.3 - 1.6 |
| Kaposi sarcoma | 192 | 0.1% | 0.7 | 0.6 - 0.8 | 9 | 0.0% | 0.0 | 0.0 - 0.1 |
| Major salivary glands | 744 | 0.4% | 2.8 | 2.6 - 3.0 | 155 | 0.2% | 0.6 | 0.5 - 0.7 |
| Mesothelioma | 894 | 0.5% | 3.4 | 3.2 - 3.6 | 666 | 0.9% | 2.5 | 2.3 - 2.7 |
| Middle ear | 11 | 0.0% | 0.0 | 0.0 - 0.1 | ** | ** | ** | ** |
| Nasal cavity and paranasal sinuses | 335 | 0.2% | 1.2 | 1.1 - 1.4 | 73 | 0.1% | 0.3 | 0.2 - 0.3 |
| Penis | 496 | 0.3% | 1.8 | 1.7 - 2.0 | 94 | 0.1% | 0.4 | 0.3 - 0.4 |
| Peritoneum, omentum and mesentery | 127 | 0.1% | 0.5 | 0.4 - 0.6 | 32 | 0.0% | 0.1 | 0.1 - 0.2 |
| Pleura | 34 | 0.0% | 0.1 | 0.1 - 0.2 | ** | ** | ** | ** |
| Retroperitoneum | 224 | 0.1% | 0.8 | 0.7 - 0.9 | 30 | 0.0% | 0.1 | 0.1 - 0.2 |
| Small intestine | 1,203 | 0.6% | 4.4 | 4.1 - 4.6 | 251 | 0.3% | 0.9 | 0.8 - 1.1 |
| Soft tissue including heart | 1,764 | 0.9% | 6.5 | 6.2 - 6.8 | 535 | 0.7% | 2.0 | 1.8 - 2.2 |
| Thymus and mediastinum | 252 | 0.1% | 0.9 | 0.8 - 1.0 | 20 | 0.0% | 0.1 | 0.0 - 0.1 |
| Trachea | 94 | 0.0% | 0.3 | 0.3 - 0.4 | 13 | 0.0% | 0.0 | 0.0 - 0.1 |
| Ureter and renal pelvis | 482 | 0.2% | 1.8 | 1.6 - 2.0 | 71 | 0.1% | 0.3 | 0.2 - 0.3 |
| Females | ||||||||
| Anus, anal canal and anorectum | 838 | 0.4% | 2.7 | 2.5 - 2.9 | 138 | 0.2% | 0.4 | 0.4 - 0.5 |
| Appendix | 690 | 0.4% | 2.3 | 2.1 - 2.5 | 91 | 0.1% | 0.3 | 0.2 - 0.4 |
| Bones and joints | 323 | 0.2% | 1.1 | 1.0 - 1.2 | 120 | 0.2% | 0.4 | 0.3 - 0.5 |
| Eye and orbit | 364 | 0.2% | 1.2 | 1.1 - 1.3 | 45 | 0.1% | 0.1 | 0.1 - 0.2 |
| Gallbladder and other biliary | 1,681 | 0.9% | 5.1 | 4.9 - 5.4 | 542 | 0.8% | 1.6 | 1.5 - 1.7 |
| Kaposi sarcoma | 40 | 0.0% | 0.1 | 0.1 - 0.2 | ** | ** | ** | ** |
| Major salivary glands | 478 | 0.2% | 1.5 | 1.4 - 1.7 | 80 | 0.1% | 0.2 | 0.2 - 0.3 |
| Mesothelioma | 253 | 0.1% | 0.8 | 0.7 - 0.9 | 150 | 0.2% | 0.5 | 0.4 - 0.5 |
| Middle ear | 3 | 0.0% | 0.0 | 0.0 - 0.0 | 0 | 0.0% | 0.0 | 0.0 - 0.0 |
| Nasal cavity and paranasal sinuses | 232 | 0.1% | 0.7 | 0.6 - 0.8 | 50 | 0.1% | 0.1 | 0.1 - 0.2 |
| Peritoneum, omentum and mesentery | 225 | 0.1% | 0.7 | 0.6 - 0.8 | 135 | 0.2% | 0.4 | 0.3 - 0.5 |
| Pleura | 26 | 0.0% | 0.1 | 0.1 - 0.1 | ** | ** | ** | ** |
| Retroperitoneum | 205 | 0.1% | 0.7 | 0.6 - 0.8 | 25 | 0.0% | 0.1 | 0.0 - 0.1 |
| Small intestine | 1,089 | 0.6% | 3.4 | 3.2 - 3.7 | 211 | 0.3% | 0.6 | 0.6 - 0.7 |
| Soft tissue including heart | 1,316 | 0.7% | 4.3 | 4.0 - 4.5 | 506 | 0.8% | 1.6 | 1.5 - 1.7 |
| Thymus and mediastinum | 158 | 0.1% | 0.5 | 0.4 - 0.6 | 7 | 0.0% | 0.0 | 0.0 - 0.0 |
| Trachea | 68 | 0.0% | 0.2 | 0.2 - 0.3 | 8 | 0.0% | 0.0 | 0.0 - 0.1 |
| Ureter and renal pelvis | 352 | 0.2% | 1.0 | 0.9 - 1.2 | 48 | 0.1% | 0.1 | 0.1 - 0.2 |
| Vagina | 493 | 0.3% | 1.5 | 1.4 - 1.7 | 99 | 0.1% | 0.3 | 0.2 - 0.4 |
| Vulva | 1,605 | 0.8% | 5.0 | 4.7 - 5.2 | 393 | 0.6% | 1.1 | 1.0 - 1.3 |
Abbreviation: ASIR means age-standardized incidence rate; ASMR means age-standardized mortality rate; CI means confidence interval.
Symbols:
- **Suppressed due to small case counts (less than 6).
- †Rates are per 100,000 and age-standardized to the age distribution of the 2011 Canadian population.
Analysis by: Surveillance, Analytics and Informatics, Ontario Health (Cancer Care Ontario),
Data source: Ontario Cancer Registry (December 2018), Ontario Health (Cancer Care Ontario)
The ASIR of rare cancers began declining earlier and at a lower rate (0.8% per year since 1999) than common cancers (1.4% per year since 2011) (Table 4.2). The decline in rare cancers mainly reflects a decrease among males, as the female incidence rate has been stable since 2008.
Significant recent trends were seen for the following rare cancers (Table 4.2):
- Increasing incidence rate: appendix, gallbladder and other biliary, male breast, nasal cavity and paranasal sinuses, penis, soft tissue including heart, thymus and mediastinum, vulva
- Decreasing incidence rate: eye and orbit, pleura, trachea, peritoneum, omentum and mesentery, vagina
- Increasing mortality rate: anus, anal canal and anorectum, appendix, small intestine, soft tissue including heart, vulva
- Decreasing mortality rate: nasal cavity and paranasal sinuses, vagina
The following cancers showed long-term changes in trend since 1981:
- Increasing incidence rate: major salivary glands, mesothelioma
- Decreasing incidence rate: middle ear
- Increasing mortality rate: peritoneum, omentum and mesentery
- Decreasing mortality rate: thymus and mediastinum, trachea, ureter and renal pelvis
Table 4.2 Annual percent change in age-standardized incidence and mortality rates for rare and common cancers by sex, Ontario, 1981 to 2016
Select links for tables 4.2A through 4.2F to view tables.
Incidence
| Cancer type | Incidence | |
|---|---|---|
| Period | APC (%) | |
| Common cancers | 1981 - 2000 | 0.7* |
| 2000 - 2011 | 0.1 | |
| 2011 - 2016 | -1.4* | |
| Rare cancers | 1981 - 1991 | 0.4* |
| 1991 - 1996 | -1.4 | |
| 1996 - 1999 | 1.0 | |
| 1999 - 2016 | -0.8* | |
| Anus, anal canal and anorectum | 1981 - 1995 | -1.1 |
| 1995 - 2004 | 3.6* | |
| 2004 - 2012 | -5.6* | |
| 2012 - 2016 | 3.8 | |
| Appendix | 1981 - 2003 | 3.2* |
| 2003 - 2016 | 10.4* | |
| Bones and joints | 1981 - 2016 | -0.3 |
| Eye and orbit | 1981 - 2016 | -0.3* |
| Gallbladder and other biliary | 1981 - 2006 | -0.9* |
| 2006 - 2016 | 3.8* | |
| Kaposi sarcoma | 1981 - 1987 | 36.8* |
| 1987 - 1994 | 2.7 | |
| 1994 - 2000 | -20.7* | |
| 2000 - 2016 | -0.9 | |
| Major salivary glands | 1981 - 2016 | 1.2* |
| Mesothelioma† | 1981 - 2016 | 2.3* |
| Middle ear | 1981 - 2016 | -4.3* |
| Nasal cavity and paranasal sinuses | 1981 - 2004 | -1.6* |
| 2004 - 2016 | 1.9* | |
| Peritoneum, omentum and mesentery | 1981 - 2008 | 4.1* |
| 2008 - 2012 | 45.7* | |
| 2012 - 2016 | -10.5* | |
| Pleura | 1981 - 2016 | -2* |
| Retroperitoneum | 1981 - 2007 | -2.1* |
| 2007 - 2011 | 65.7* | |
| 2011 - 2016 | -4.1 | |
| Small intestine | 1981 - 2008 | 2.1* |
| 2008 - 2011 | 13.7 | |
| 2011 - 2016 | 0.4 | |
| Soft tissue including heart | 1981 - 2016 | 1* |
| Thymus and mediastinum | 1981 - 2016 | 0.3 |
| Trachea | 1981 - 2016 | -3.2* |
| Ureter and renal pelvis | 1981 - 2016 | -0.3 |
Abbreviation: APC means average percent change.
Symbols:
- * Statistically significant changes in trend
- ** Too few cases to measure trend
- †Mesothelioma was only included in ICD in the 10th edition. As a result, mortality trends begin in 2000.
Notes:
- Incidence counts are based on IARC/IACR multiple primary rules.
- Rates are age-standardized to the age distribution of the 2011 Canadian population.
Analysis by: Surveillance, Analytics and Informatics, Ontario Health (Cancer Care Ontario)
Data source: Ontario Cancer Registry (December 2018), Ontario Health (Cancer Care Ontario)
| Cancer type | Incidence | |
|---|---|---|
| Period | APC (%) | |
| Common cancers | 1981 - 2007 | 0.4* |
| 2007 - 2016 | -2.1* | |
| Rare cancers | 1981 - 1990 | 0.7* |
| 1990 - 2016 | -0.8* | |
| Anus, anal canal and anorectum | 1981 - 2004 | 0.6 |
| 2004 - 2016 | -5.1* | |
| Appendix | 1981 - 2002 | 1.9 |
| 2002 - 2016 | 9.5* | |
| Bones and joints | 1981 - 2016 | -0.2 |
| Breast (male) | 1981 - 2016 | 0.7* |
| Eye and orbit | 1981 - 2016 | -0.2 |
| Gallbladder and other biliary | 1981 - 2006 | -0.2 |
| 2006 - 2016 | 4.5* | |
| Kaposi sarcoma | 1981 - 1987 | 40.8* |
| 1987 - 1994 | 3 | |
| 1994 - 1999 | -24* | |
| 1999 - 2016 | -1.6 | |
| Major salivary glands | 1981 - 2016 | 1.3* |
| Mesothelioma† | 1981 - 2006 | 3.6* |
| 2006 - 2016 | 0.0 | |
| Middle ear | ** | ** |
| Nasal cavity and paranasal sinuses | 1981 - 2004 | -1.6* |
| 2004 - 2016 | 1.6 | |
| Penis | 1981 - 2005 | -1.3* |
| 2005 - 2016 | 3.5* | |
| Peritoneum, omentum and mesentery | ** | ** |
| Pleura | 1981 - 2016 | -2.4* |
| Retroperitoneum | 1981 - 2007 | -4.4* |
| 2007 - 2010 | 111.8 | |
| 2010 - 2016 | 0.9 | |
| Small intestine | 1981 - 2016 | 3* |
| Soft tissue including heart | 1981 - 2016 | 1.2* |
| Thymus and mediastinum | 1981 - 2016 | 0.1 |
| Trachea | 1981 - 2016 | -3.8* |
| Ureter and renal pelvis | 1981 - 2016 | -0.7* |
Abbreviation: APC means average percent change.
Symbols:
- * Statistically significant changes in trend
- ** Too few cases to measure trend
- †Mesothelioma was only included in ICD in the 10th edition. As a result, mortality trends begin in 2000.
Notes:
- Incidence counts are based on IARC/IACR multiple primary rules.
- Rates are age-standardized to the age distribution of the 2011 Canadian population.
Analysis by: Surveillance, Analytics and Informatics, Ontario Health (Cancer Care Ontario)
Data source: Ontario Cancer Registry (December 2018), Ontario Health (Cancer Care Ontario)
| Cancer type | Incidence | |
|---|---|---|
| Period | APC (%) | |
| Common cancers | 1981 - 2000 | 0.7* |
| 2000 - 2008 | 0.2 | |
| 2008 - 2011 | 2.0 | |
| 2011 - 2016 | -0.6 | |
| Rare cancers | 1981 - 2008 | -0.2* |
| 2008 - 2011 | -3.3 | |
| 2011 - 2016 | 0.9 | |
| Anus, anal canal and anorectum | 1981 - 1996 | -1 |
| 1996 - 2002 | 5.3 | |
| 2002 - 2016 | -1.4* | |
| Appendix | 1981 - 2003 | 4* |
| 2003 - 2016 | 10.6* | |
| Bones and joints | 1981 - 2016 | -0.3 |
| Eye and orbit | 1981 - 2016 | -0.5* |
| Gallbladder and other biliary | 1981 - 2005 | -1.5* |
| 2005 - 2016 | 2.8* | |
| Kaposi sarcoma | 1981 - 2016 | -2.6* |
| Major salivary glands | 1981 - 2016 | 0.9* |
| Mesothelioma† | 1981 - 2016 | 2.2* |
| Middle ear | ** | ** |
| Nasal cavity and paranasal sinuses | 1981 - 2016 | -0.4 |
| Peritoneum, omentum and mesentery | ** | ** |
| Pleura | ** | ** |
| Retroperitoneum | 1981 - 2008 | -0.2 |
| 2008 - 2011 | 78.3 | |
| 2011 - 2016 | -7 | |
| Small intestine | 1981 - 2001 | 1.2* |
| 2001 - 2016 | 5.4* | |
| Soft tissue including heart | 1981 - 2016 | 0.8* |
| Thymus and mediastinum | 1981 - 2016 | 0.4 |
| Trachea | 1981 - 2016 | -2.1* |
| Ureter and renal pelvis | 1981 - 1997 | -2.2 |
| 1997 - 2003 | 8.7 | |
| 2003 - 2016 | -2.4 | |
| Vagina | 1981 - 2006 | -1.5* |
| 2006 - 2016 | 5.5* | |
| Vulva | 1981 - 2003 | -0.1 |
| 2003 - 2016 | 2.9* | |
Abbreviation: APC means average percent change.
Symbols:
- * Statistically significant changes in trend
- ** Too few cases to measure trend
- †Mesothelioma was only included in ICD in the 10th edition. As a result, mortality trends begin in 2000.
Notes:
- Incidence counts are based on IARC/IACR multiple primary rules.
- Rates are age-standardized to the age distribution of the 2011 Canadian population.
Analysis by: Surveillance, Analytics and Informatics, Ontario Health (Cancer Care Ontario)
Data source: Ontario Cancer Registry (December 2018), Ontario Health (Cancer Care Ontario)
Mortality
| Cancer type | Mortality | |
|---|---|---|
| Period | APC (%) | |
| Common cancers | 1981 - 1988 | 0.3 |
| 1988 - 2001 | -0.8* | |
| 2001 - 2016 | -1.7* | |
| Rare cancers | 1981 - 2002 | 0.4* |
| 2002 - 2016 | -1.1* | |
| Anus, anal canal and anorectum | 1981 - 2016 | 1.7 |
| Appendix | 1981 - 1998 | -1.1 |
| 1998 - 2016 | 8.6 | |
| Bones and joints | 1981 - 2016 | 0.2 |
| Eye and orbit | 1981 - 1988 | 2.8 |
| 1988 - 1995 | -13.9 | |
| 1995 - 2016 | -0.4 | |
| Gallbladder and other biliary | 1981 - 2009 | -3.4 |
| 2009 - 2016 | 0.0 | |
| Kaposi sarcoma | ** | ** |
| Major salivary glands | 1981 - 2016 | -0.5 |
| Mesothelioma† | 2000 - 2005 | 4.7 |
| 2005 - 2016 | -0.9 | |
| Middle ear | ** | ** |
| Nasal cavity and paranasal sinuses | 1981 - 2016 | -2.2 |
| Peritoneum, omentum and mesentery | 1981 - 2016 | 0.9 |
| Pleura | ** | ** |
| Retroperitoneum | 1981 - 2001 | -7.4 |
| 2001 - 2016 | -0.6 | |
| Small intestine | 1981 - 1991 | -5.5 |
| 1991 - 2016 | 1.8 | |
| Soft tissue including heart | 1981 - 2016 | 1.4 |
| Thymus and mediastinum | 1981 - 2016 | -5.2 |
| Trachea | ** | ** |
| Ureter and renal pelvis | 1981 - 2016 | -1.9 |
Abbreviation: APC means average percent change.
Symbols:
- * Statistically significant changes in trend
- ** Too few cases to measure trend
- †Mesothelioma was only included in ICD in the 10th edition. As a result, mortality trends begin in 2000.
Notes:
- Incidence counts are based on IARC/IACR multiple primary rules.
- Rates are age-standardized to the age distribution of the 2011 Canadian population.
Analysis by: Surveillance, Analytics and Informatics, Ontario Health (Cancer Care Ontario)
Data source: Ontario Cancer Registry (December 2018), Ontario Health (Cancer Care Ontario)
| Cancer type | Mortality | |
|---|---|---|
| Period | APC (%) | |
| Common cancers | 1981 - 1988 | 0.3 |
| 1988 - 2001 | -1.2* | |
| 2001 - 2016 | -2.1* | |
| Rare cancers | 1981 - 2001 | 0.5* |
| 2001 - 2016 | -1.2* | |
| Anus, anal canal and anorectum | 1981 - 2016 | 0.8 |
| Appendix | ** | ** |
| Bones and joints | 1981 - 2016 | 0.1 |
| Breast (male) | 1981 - 2016 | -1.1 |
| Eye and orbit | 1981 - 2016 | -3.3 |
| Gallbladder and other biliary | 1981 - 2004 | -2.5 |
| 2004 - 2007 | -12.6 | |
| 2007 - 2016 | 2.1 | |
| Kaposi sarcoma | ** | ** |
| Major salivary glands | 1981 - 2016 | -0.5 |
| Mesothelioma† | 2000 - 2005 | 4.3 |
| 2005 - 2016 | -1.5 | |
| Middle ear | ** | ** |
| Nasal cavity and paranasal sinuses | 1981 - 2016 | -2.3 |
| Penis | 1981 - 2016 | -0.5 |
| Peritoneum, omentum and mesentery | ** | ** |
| Pleura | ** | ** |
| Retroperitoneum | 1981 - 2016 | -4.9 |
| Small intestine | 1981 - 1991 | -3.7 |
| 1991 - 2016 | 1.4 | |
| Soft tissue including heart | 1981 - 2016 | 1.2 |
| Thymus and mediastinum | 1981 - 2016 | -4.3 |
| Trachea | ** | ** |
| Ureter and renal pelvis | 1981 - 2016 | -1.2 |
Abbreviation: APC means average percent change.
Symbols:
- * Statistically significant changes in trend
- ** Too few cases to measure trend
- †Mesothelioma was only included in ICD in the 10th edition. As a result, mortality trends begin in 2000.
Notes:
- Incidence counts are based on IARC/IACR multiple primary rules.
- Rates are age-standardized to the age distribution of the 2011 Canadian population.
Analysis by: Surveillance, Analytics and Informatics, Ontario Health (Cancer Care Ontario)
Data source: Ontario Cancer Registry (December 2018), Ontario Health (Cancer Care Ontario)
| Cancer type | Mortality | |
|---|---|---|
| Period | APC (%) | |
| Common cancers | 1981 - 1985 | 1.1 |
| 1985 - 2001 | -0.4* | |
| 2001 - 2016 | -1.4* | |
| Rare cancers | 1981 - 2002 | 0.4* |
| 2002 - 2016 | -1.1* | |
| Anus, anal canal and anorectum | 1981 - 1993 | -5.0 |
| 1993 - 2003 | 9.3 | |
| 2003 - 2006 | -12.3 | |
| 2006 - 2013 | 5.7 | |
| Appendix | ** | ** |
| Bones and joints | 1981 - 2016 | 0.4 |
| Eye and orbit | 1981 - 1986 | 9.6 |
| 1986 - 1997 | -12.2 | |
| 1997 - 2016 | 0.9 | |
| Gallbladder and other biliary | 1981 - 1995 | -4.4 |
| 1995 - 2016 | -2.3 | |
| Kaposi sarcoma | ** | ** |
| Major salivary glands | 1981 - 2016 | -0.9 |
| Mesothelioma† | 2000 - 2016 | 2.0 |
| Middle ear | ** | ** |
| Nasal cavity and paranasal sinuses | 1981 - 2016 | -2.3 |
| Peritoneum, omentum and mesentery | 1981 - 2016 | 2.3 |
| Pleura | ** | ** |
| Retroperitoneum | 1981 - 1995 | -9.8 |
| 1995 - 2016 | -1.3 | |
| Small intestine | 1981 - 1991 | -6.2 |
| 1991 - 2016 | 2.2 | |
| Soft tissue including heart | 1981 - 1996 | 1.3 |
| 1996 - 1999 | 20.3 | |
| 1999 - 2003 | -8.9 | |
| 2003 - 2016 | 1.3 | |
| Thymus and mediastinum | ** | ** |
| Trachea | ** | ** |
| Ureter and renal pelvis | 1981 - 2016 | -2.6 |
| Vagina | 1981 - 2016 | -1.3 |
| Vulva | 1981 - 1989 | 4.8 |
| 1989 - 1992 | -15.3 | |
| 1992 - 2016 | 2.7 | |
Abbreviation: APC means average percent change.
Symbols:
- * Statistically significant changes in trend
- ** Too few cases to measure trend
- †Mesothelioma was only included in ICD in the 10th edition. As a result, mortality trends begin in 2000.
Notes:
- Incidence counts are based on IARC/IACR multiple primary rules.
- Rates are age-standardized to the age distribution of the 2011 Canadian population.
Analysis by: Surveillance, Analytics and Informatics, Ontario Health (Cancer Care Ontario)
Data source: Ontario Cancer Registry (December 2018), Ontario Health (Cancer Care Ontario)
Rare cancers by selected body systems
Digestive system
Since 1981, the most common rare cancer of the digestive system has been the group known as gallbladder and other biliary cancers. The ASIR for these cancers in 2016 was higher in males (6.2 per 100,000) than females (5.1 per 100,000) (Table 4.1), and overall, was consistently higher between 1981 and 2016 (Figure 4.7). Although the ASIR for this cancer group decreased by 0.9% per year between 1981 and 2006, it increased by 3.8% per year after 2006 (Table 4.2). The earlier decrease was limited to females. However, the increase after 2006 was driven by the rate in males.
The most common rare cancer of the digestive system is the group known as gallbladder and other biliary cancers.
The increase in gallbladder and other biliary cancer may be due to increasing levels of obesity. Gallbladder cancer risk is estimated to be 68% to 78% higher in obese women and 43% to 54% higher in obese men compared with normal weight people.[15]
Small intestine cancer was the second most common rare digestive cancer (Figure 4.7). The ASIR increased by 3.0% per year in males between 1981 and 2016, and by 5.4% per year in females between 2001 and 2016 (Table 4.2). The faster increase in the incidence of small intestine cancer in recent years may be partly because of increased detection using new technology, particularly video capsule endoscopy.[16,17]
Anal and appendix cancers were 2 of the few cancers for which the ASIR was significantly higher in females than males (Table 4.1). Anal cancer incidence declined between 2004 and 2012, and has been stable since 2012 (Table 4.2). By sex, the ASIR continued to decline until 2016, with the decline greater in males (5.1%) than females (1.4%). Appendix cancer, on the other hand, has been increasing, with a slightly greater increase among females than males (10.6% since 2003 versus 9.5% per year since 2002, respectively). A similar increase in cancer of the appendix was seen in the U.S. However, the reasons for these increases are not clear.[18]
The incidence of rare digestive cancers in Ontario differs considerably from the incidence in the U.S., where the most common rare digestive cancer was small intestine followed by anus, anal canal and anorectum.[4] Race may play a role, as small intestine and anal cancers in the U.S. are most common in Blacks and Hispanic whites.[4]
Gallbladder and other biliary cancers, as a group, continue to be the most common cause of death among the rare digestive cancers (Figure 4.8), despite their declining mortality rate of 3.4% per year between 1981 and 2009 (Table 4.2).
One commonly cited reason for the decline in gallbladder incidence and mortality is the introduction of new technologies such as laparoscopic cholecystectomy. This has led to improved diagnosis of cholelithiasis (the main risk factor for gallbladder cancer).[19-23] However, some studies have pointed out that, in many jurisdictions, gallbladder cancer mortality decreased before the procedure was introduced, and that the true reason is still unknown.[24] Incidence of this group of cancers shows an increasing trend in the past decade (Figure 4.7).
The second most common cause of death among rare digestive cancers was small intestine cancer (Figure 4.8). Since 1991, the ASMR has been increasing by 1.8% per year, with the rate of increase greater among females (Table 4.2). Reasons for the increase in small intestine cancer are unclear. Risk factors, etiology and biology of this cancer type are not well understood.[25]
As a group, peritoneum, omentum and mesentery cancer was the only rare digestive system cancer for which the female ASMR was higher than the male ASMR.
Respiratory system
Of the rare cancers of the respiratory system, mesothelioma had the highest incidence rate, followed by cancer of the nasal cavity and paranasal sinuse s (Figure 4.9). The rate of mesothelioma was more than 4 times higher in males (3.4 per 100,000) than females (0.8 per 100,000) from 2012 to 2016 (Table 4.1). The higher rate in males is largely due to occupational exposure to asbestos.[26,27] Mesothelioma incidence has been steadily increasing since 1981 by 2.3% per year (Table 4.2). This rate of increase stabilized in males in 2006, but continues to increase among females.
Of rare respiratory system cancers, mesothelioma had the highest incidence rate.
The incidence rate of nasal cavity and paranasal sinus cancer was comparable between males (1.4 per 100,000) and females (0.9 per 100,000) (Table 4.1). The incidence rate for both sexes combined declined by 1.4% per year between 1981 and 2001, before increasing by 2.4% per year until 2016 (Table 4.2). These trends, however, have been driven by male rates.
Over the past 15 years, mesothelioma, and nasal cavity and paranasal sinus cancer had the highest mortality rates among rare cancers of the respiratory system (Figure 4.10). Mesothelioma mortality figures have been available only since 2000, with the introduction of a new edition of mortality codes.
After 2000, the mortality rate for mesothelioma increased by 4.7% per year until 2005 and then stabilized (Table 4.2). Since 2005, the mortality rate among males has decreased by 1.5% per year; the female rate has remained stable since 2000. From 2012 to 2016, the male mortality rate for mesothelioma was 5 times higher than that for females.
Nasal cavity and paranasal sinus cancer mortality has been declining by 2.2% per year since 1981, while thymus and mediastinum cancer declined even faster, at 5.2% per year (Table 4.2). Trachea and pleura cancers have too few deaths to estimate trends over time.
Genitourinary system
Since 1981, vulva cancer has had the highest incidence rate of rare genitourinary cancers (Figure 4.11). The vulva cancer incidence rate has increased 2.9% per year since 2003 (Table 4.2).
Vulva cancer has the highest incidence rate of rare genitourinary cancers.
Penile cancer, the second most commonly diagnosed rare genitourinary cancer during 2012 to 2016, increased 1.3% per year since 2005 (Table 4.2).
Increases in vulva and penile cancer incidence have been attributed to increased prevalence[*] of infection with HPV [28-30] and, for penile cancer, decreased rates of childhood circumcision.[31,32] Approximately 40% of vulvar cancers [33] and at least 20% of penile cancers[34,35] are believed to be associated with HPV.
Trends in the mortality rate for genitourinary rare cancers were similar to incidence trends. Vulva cancer was the most common cause of cancer death (Figure 4.12). Following a decade of stable rates, vulva cancer mortality increased by 2.7% per year between 1992 and 2016 (Table 4.2). Vulva cancer is the only rare cancer of the genitourinary system with an increasing mortality trend in the most recent period.
The second most common cause of death among genitourinary rare cancers was penile cancer, for which the trend has remained stable since 1981 (Table 4.2). Mortality from cancer of the vagina has been declining by 1.3% per year since 1981, while ureter and renal pelvis cancer declined by 1.9% over the same period.
Survival From Selected Rare Cancers
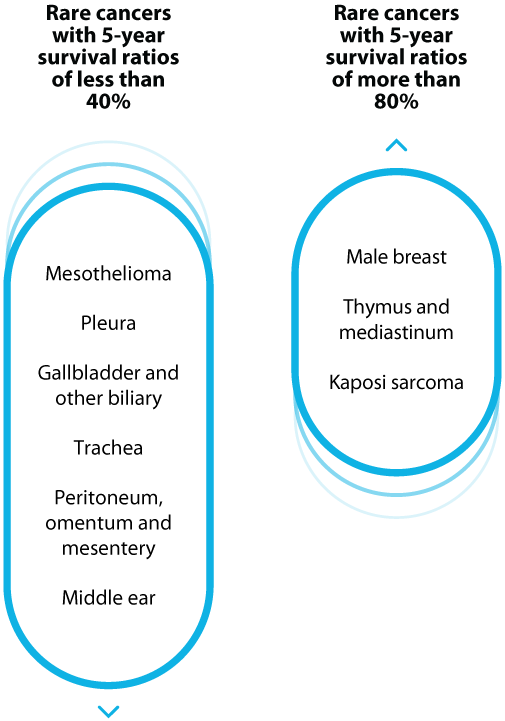
Five-year relative survival for the rare cancers ranged from 11.5% to 84.1% (Table 4.3).
The following cancers had 5-year survival ratios of less than 40%:
- Mesothelioma, pleura, gallbladder and other biliary, trachea, peritoneum, omentum and mesentery, middle ear
Mesothelioma is an aggressive disease that is difficult to treat, resulting in low survival.[36]
This is also the only cancer that showed a significant survival difference between males (6.8%) and females (31.2%) (Table 4.3). Use caution when comparing male and female survival ratios because of their low-precision estimates. This survival advantage among females has been attributed to lower exposure to asbestos, especially in non-occupational settings. Females are more likely to be exposed to a small quantity of asbestos through a household contact, where males are more likely to be exposed at work.[37]
Low survival from trachea cancer has been attributed to delays in diagnosis (due to non-specific symptoms) and lack of treatment options (particularly surgery).[38-40]
Only a few rare cancers had 5-year survival of more than 80%:
- male breast, thymus and mediastinum, Kaposi sarcoma
| Cancer type | Both sexes | Males | Females | |||
|---|---|---|---|---|---|---|
| RSR (%) | 95% CI | RSR (%) | 95% CI | RSR (%) | 95% CI | |
| Anus, anal canal and anorectum | 67.1 | 62.4 - 71.3 | 65.1 | 57.0 - 72.1 | 68.3 | 62.4 - 73.4 |
| Appendix | 79.4 | 74.9 - 83.2 | 74.5 | 66.8 - 80.7 | 82.8 | 77.2 - 87.2 |
| Bones and joints | 62.4 | 56.3 - 67.8 | 60.6 | 52.4 - 67.8 | 63.9 | 54.7 - 71.7 |
| Breast (male) | n/a | n/a | 85.3 | 75.8 - 91.3 | n/a | n/a |
| Eye and orbit | 77.3 | 71.5 - 82.0 | 76.2 | 67.9 - 82.6 | 78.4 | 69.8 - 84.8 |
| Gallbladder and other biliary | 19.3 | 17.1 - 21.6 | 20.1 | 16.9 - 23.5 | 18.4 | 15.5 - 21.5 |
| Kaposi sarcoma | 84.6 | 72.3 - 91.8 | 83.7 | 70.3 - 91.4 | 88.2 | 36.2 - 98.5 |
| Major salivary glands | 71.3 | 66.2 - 75.8 | 67.4 | 60.2 - 73.6 | 76.2 | 68.8 - 82.1 |
| Mesothelioma | 11.9 | 9.0 - 15.4 | 7.0 | 4.6 - 10.1 | 32.5 | 23.2 - 42.2 |
| Middle ear | 24.9 | 3.2 - 57.1 | 26.9 | 3.0 - 61.2 | ** | ** |
| Nasal cavity and paranasal sinuses | 51.7 | 44.3 - 58.7 | 50.5 | 40.8 - 59.4 | 53.5 | 41.7 - 63.9 |
| Penis | n/a | n/a | 72.9 | 63.7 - 80.1 | n/a | n/a |
| Peritoneum, omentum and mesentery | 22.7 | 15.1 - 31.4 | 32.8 | 17.1 - 49.4 | 18.5 | 10.4 - 28.3 |
| Pleura | 18.7 | 4.0 - 41.7 | 17.5 | 1.3 - 49.9 | ** | ** |
| Retroperitoneum | 57.4 | 48.9 - 64.9 | 56.3 | 44.1 - 66.8 | 58.6 | 46.6 - 68.8 |
| Small intestine | 59.5 | 55.9 - 63.0 | 62.4 | 57.3 - 67.2 | 56.4 | 51.1 - 61.3 |
| Soft tissue including heart | 63.3 | 60.0 - 66.3 | 64.0 | 59.7 - 67.9 | 61.9 | 56.9 - 66.6 |
| Thymus and mediastinum | 81.7 | 73.8 - 87.4 | 80.9 | 70.4 - 88.0 | 82.0 | 67.4 - 90.5 |
| Trachea | 30.2 | 13.1 - 49.3 | 29.6 | 6.9 - 57.5 | 20.7 | 4.3 - 45.5 |
| Ureter and renal pelvis | 50.6 | 44.0 - 56.8 | 50.3 | 41.5 - 58.5 | 50.5 | 40.5 - 59.7 |
| Vagina | n/a | n/a | n/a | n/a | 48.4 | 39.0 - 57.1 |
| Vulva | n/a | n/a | n/a | n/a | 68.4 | 64.0 - 72.4 |
Abbreviations: CI means confidence interval; RSR means relative survival ratio.
Symbol: **Too few cases to calculate ratio.
Note: Analysis restricted to ages 15 to 99.
Analysis by: Surveillance, Analytics and Informatics, Ontario Health (Cancer Care Ontario)
Data source: Ontario Cancer Registry (December 2018), Ontario Health (Cancer Care Ontario)
While cancer survival in general has been improving over time in Ontario, improvement in survival among rare cancers has been more limited. Only 4 of the rare cancers showed a significant increase in 5-year survival between the periods 1981 to 1985 and 2012 to 2016 (Table 4.4):
- Gallbladder and other biliary – from 13.5% to 21.1%
- Retroperitoneum – from 32.3% to 54.8%
- Small intestine – from 31.0% to 58.2%
- Thymus and mediastinum – from 29.9% to 75.9%
Given that some of these improvements were also accompanied by decreases in mortality (Table 4.2), it is likely that at least some of these survival gains are a sign of actual improvements in prognosis and not simply a reflection of lead-time bias (see Glossary) associated with earlier detection.
The improvement in gallbladder cancer could be the result of the increased use of cholecystectomies. Use of this procedure has resulted in earlier diagnosis of gallbladder cancer, which historically tended to be diagnosed at later stages with poorer survival.[41,42]
| Cancer type | 1981 to 1985 | 2012 to 2016 | ||
|---|---|---|---|---|
| RSR (%) | 95% CI | RSR (%) | 95% CI | |
| Anus, anal canal and anorectum | 61.2 | 56.4 - 65.6 | 62.3 | 57.3 - 67.0 |
| Appendix | 55.5 | 42.3 - 66.9 | 69.2 | 62.0 - 75.3 |
| Bones and joints | 50.1 | 43.4 - 56.4 | 54.8 | 45.8 - 63.0 |
| Breast (male) | 70.5 | 60.6 - 78.4 | 84.8 | 75.6 - 90.7 |
| Eye and orbit | 73.2 | 65.8 - 79.3 | 75.2 | 68.1 - 80.9 |
| Gallbladder and other biliary* | 13.6 | 11.4 - 15.9 | 21.1 | 18.6 - 23.6 |
| Kaposi sarcoma | 67.8 | 55.9 - 77.1 | 81.5 | 69.0 - 89.3 |
| Major salivary glands | 62.9 | 56.2 - 68.8 | 67.5 | 62.0 - 72.4 |
| Mesothelioma | 11.7 | 7.4 - 17.0 | 17.6 | 13.3 - 22.4 |
| Middle ear | 28.6 | 17.3 - 40.9 | ** | ** |
| Nasal cavity and paranasal sinuses | 56.9 | 49.2 - 64 | 50.3 | 42.9 - 57.3 |
| Penis | 70.9 | 60.4 - 79.0 | 73.3 | 64.4 - 80.3 |
| Peritoneum, omentum and mesentery | ** | ** | 23.6 | 15.7 - 32.5 |
| Pleura | 16.1 | 7.5 - 27.6 | ** | ** |
| Retroperitoneum* | 32.3 | 20.1 - 45.1 | 54.5 | 43.9 - 64.0 |
| Small intestine* | 32.3 | 27.2 - 37.5 | 58.3 | 54.8 - 61.6 |
| Soft tissue including heart | 60.8 | 57.5 - 64.0 | 61.3 | 58.4 - 64.2 |
| Thymus and mediastinum* | 31.6 | 22.1 - 41.5 | 73.6 | 61.2 - 82.6 |
| Trachea | 11.4 | 6.4 - 17.9 | ** | ** |
| Ureter and renal pelvis | 58.0 | 52.0 - 63.6 | ** | ** |
| Vagina | 50.7 | 42.7 - 58.2 | 48.9 | 39.4 - 57.7 |
| Vulva | 76.1 | 70.5 - 80.7 | 70.2 | 65.6 - 74.2 |
Abbreviations: CI means confidence interval; RSR means relative survival ratio.
Symbols:
- *RSR significantly increased in the most recent period compared with the previous period.
- **Too few cases to calculate ratio.
Notes:
- Analysis was restricted to ages 15 to 99.
- Cases counts based on incidence using IARC/IACR multiple primary counts to facilitate comparison over time.
- Cohort method was used for the 1981 to 1985 period. The period method was used for the 2012 to 2016 period.
Analysis by: Surveillance, Analytics and Informatics, Ontario Health (Cancer Care Ontario)
Data source: Ontario Cancer Registry (December 2018), Ontario Health (Cancer Care Ontario)
Prevalence of Selected Rare Cancers
Given the low incidence and survival for rare cancers, their prevalence is also low. The highest prevalence count at all times reported was for soft tissue cancers (Figure 4.13), which had relatively high incidence rates and average survival ratios for rare cancers.
At the end of 2016, there were an estimated 5,474 survivors of soft tissue cancers diagnosed in the past 30 years. Soft tissue cancers were also unique among rare cancers for their large increase in prevalent cases from the 10-year estimate to the 30-year. However, the greatest increase in prevalence, as measured by percentage change from 5 years to 30 years, was for Kaposi sarcoma. This increase likely reflects the large number of cases diagnosed in the 1980s.
The smallest difference in prevalence for 5 years compared with 30 years was for mesothelioma and the group of peritoneum, omentum and mesentery cancers. Long-term survival appears to be more challenging for these cancers than for other rare cancers. The lowest prevalence cancers at all times reported were middle ear, pleura and trachea.
Conclusion
Information about risk factors, timely diagnosis and effective treatments is still limited for rare cancers. Prevention programs and evidence-based screening tests are also lacking. These limitations place an extra burden on people with rare cancers, as they often face longer delays in diagnosis, fewer treatment options and lower survival than people with more common cancers. As well, primary care physicians are often unfamiliar with rare cancers, and there can be a lack of specialists who treat them.
The low incidence and few survivors mean that advocacy is inadequate for those diagnosed with rare cancers, for improvements in diagnosis, and for treatment and greater research. This chapter shows that rare cancers account for approximately 20% of all cancers diagnosed in older adolescents and adults in Ontario. However, when childhood cancers, and subsites and subtypes of common cancers are included, the number is even higher. Improved strategies may be needed to support people with rare cancers.
Inclusion and Exclusion Criteria
The first sections of this chapter examine rare cancers as a group, and therefore include any cancer that meets the RARECARE definition. However, subsequent sections of this chapter examine selected rare cancers, which have been grouped by anatomical site for ease of interpretation.
Exclusions from analysis of selected rare cancers
Our analysis excludes specific examination of several types of cancer considered by RARECAREnet to be rare, specifically:
- neuroendocrine tumours
- sarcomas
- certain central nervous system tumours
- embryonal tumours
- certain hematological cancers
- certain rare skin cancers
Inclusions in analysis of rare cancers as a group
Esophageal, laryngeal, and testicular cancers, and Hodgkin lymphoma meet the definition of a rare cancer and are therefore grouped with rare cancers in the first sections of this chapter, which compare common and rare cancers. However, because of their importance, they also appear elsewhere in this report as part of the 23 cancer types of interest.
Exclusions based on classification method
Genetic information is used increasingly to group cancers by criteria such as molecular subtype. This results in the classification of even more common cancers into rare subtypes. However, genetic information is limited in most cancer registry data and, as a result, the cancers discussed in this chapter are classified exclusively by anatomic site (i.e., body structure).
Exclusions based on age of diagnosis
Cancers diagnosed in children under the age of 15 years are excluded from this chapter because all types of cancer in children meet the definition of a rare cancer.
See Spotlight: Childhood Cancer Incidence in Chapter 5 for details about childhood cancer incidence by cancer type. For more in-depth statistics on childhood cancer, visit the POGO Surveillance Report.