
Ontario Cancer Statistics 2022 Ch 1: Estimated Current Cancer Incidence
Incidence measures the number of new cancer cases diagnosed in a specific timeframe. This chapter reports projections for 2019 to 2022. The projected statistics do not account for the effects of the COVID-19 pandemic.
What's on this page
Incidence Overview
The number of new cancer cases diagnosed in Ontario (the incidence) and the incidence rate have increased each year since at least 1984. In general, the incidence of cancer is influenced by:
- socio-demographic factors (e.g., age, place of residence)
- the availability of early detection and screening for cancer
- the prevalence of risk and protective factors
Risk factors can include:
- unhealthy behaviours (e.g., smoking, poor diet, alcohol consumption, physical inactivity)
- previous treatments (e.g., hormone replacement therapy)
- exposure to certain environmental and occupational carcinogens (e.g., radon, fine particulate matter, ultraviolet rays, asbestos, diesel engine exhaust)
- medical conditions and infectious agents (e.g., Crohn’s disease, human papillomavirus)
- non-modifiable factors (e.g., age at first menstrual cycle, menopause, family history of cancer)
- genetic predispositions (e.g., BRCA1 and BRCA2 genes)
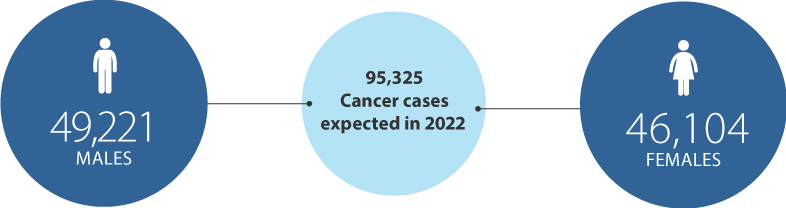
In 2022, people in Ontario are expected to be diagnosed with an estimated 95,325 new cases of cancer (excluding nonmelanoma skin cancer), which will result in an age-standardized incidence rate of 556.3 cases per 100,000 people (Figure 1.1).
Figure 1.1 shows an abrupt increase in the count and incidence rate in 2010, which is a result of the Ontario Cancer Registry's adoption of the National Cancer lnstitute’s Surveillance, Epidemiology and End Results Program rules for counting multiple primary cancers. These rules were applied to the registry for people diagnosed from 2010 onward, so the higher numbers starting in that year reflect an adoption of the new rules and not a true increase in the cancer incidence (See Appendix 2: Analysis).[1]
Incidence by Sex
Among males, 49,221 cancer cases are expected to be diagnosed in 2022 for an age-standardized incidence rate of 603.6 per 100,000 (Figure 1.2). The rapid drop in the count and rate after 2011 is partly due to the decreasing rate of prostate cancer. This decrease followed recommendations from the U.S. Preventive Services Task Force against using prostate-specific antigen testing for the routine screening of healthy men.[2] The latest statement by the task force made the same recommendations for men age 70 and older and modified them to include a choice for men ages 50 to 69.[3] Similar recommendations for prostate-specific antigen testing in Canada were published by the Canadian Task Force on Preventive Health Care in 2014.[4]
The numbers are lower for females, with 46,104 cases diagnosed and an age-standardized incidence rate of 521.4 per 100,000 (Figure 1.2). The incidence rate has been higher for males than females every year since 1984. This sex difference has been observed in many other jurisdictions.[5,6] Higher rates of cancer among males have been attributed to differences in their behaviour [7,8], immunity[9], hormones [10] and exposures (e.g., workplace carcinogens).[11,12]
Incidence by Cancer Type
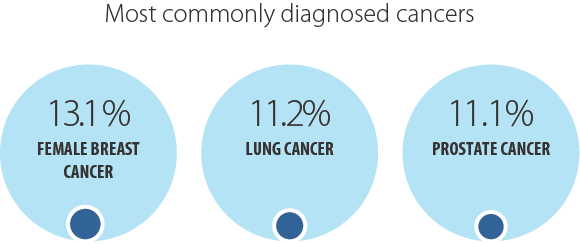
ln 2022, the most commonly diagnosed cancer is expected to be female breast cancer (12,531 cases or 13.1% of all new cases), followed by lung cancer (10,639 cases or 11.2%) and prostate cancer (10,578 cases or 11.1%) (Table 1.1). These 3 cancers are projected to account for 35% of all new cancers diagnosed in 2022.
Among males, the most commonly diagnosed cancer is expected to be prostate cancer, with an age-standardized incidence rate of 124.2 per 100,000. Breast cancer (with an age-standardized incidence rate of 147.0 per 100,000) is projected to be the most commonly diagnosed cancer among females.
The age-standardized incidence rate is expected to be higher in males than females for all cancer types listed in Table 1.1, except thyroid cancer. A higher prevalence of certain risk factors are suspected reasons for the mostly higher cancer incidence in males. These risk factors include:
- greater obesity, alcohol and tobacco use
- more occupational exposure to carcinogens
- less use of medical services
- different influence of sex hormones
The number of new thyroid cancer cases in females will outnumber male cases by more than double. This cancer has an age-standardized incidence rate of 31.8 per 100,000 in females and 13.2 per 100,000 in males. Possible reasons for the higher incidence of this cancer in females include:
- increased likelihood of diagnostic investigation for thyroid cancer [13]
- a greater tendency in general to seek medical attention [14]
- biological and hormonal factors, such as levels of thyroid stimulated hormone, levels of sex steroids, menstrual periods, use of birth control, pregnancies, breastfeeding and menopause [15-17]
The incidence of less aggressive types of thyroid cancer (e.g., papillary thyroid cancer) has been higher in females than males in a number of jurisdictions. However, the incidence of more aggressive types (e.g., anaplastic and medullary) is generally similar for males and females.[13,18] As a result, thyroid mortality rates have been fairly equal for males and females (see Chapter 5: Cancer Mortality).
| Cancer type | Males and females combined – new cases |
Males and females combined – ASIR |
Males – new cases |
Males – ASIR | Females – new cases | Females – ASIR |
|---|---|---|---|---|---|---|
| All cancers | 95,325 | 556.3 | 49,221 | 603.6 | 46,104 | 521.4 |
| Bladder | 4,445 | 24.7 | 3,411 | 41.7 | 1,034 | 10.7 |
| Brain | 1,216 | 7.5 | 704 | 9.1 | 512 | 6.0 |
| Breast (female) | n/a | n/a | n/a | n/a | 12,531 | 147.0 |
| Cervix | n/a | n/a | n/a | n/a | 583 | 7.6 |
| Colorectal | 9,118 | 52.6 | 5,098 | 63.4 | 4,020 | 43.2 |
| Esophagus | 833 | 4.7 | 602 | 7.3 | 231 | 2.4 |
| Hodgkin lymphoma | 443 | 2.9 | 234 | 3.1 | 209 | 2.7 |
| Kidney | 3,198 | 19.2 | 2,148 | 27.3 | 1,050 | 11.9 |
| Larynx | 401 | 2.3 | 345 | 4.2 | 56 | 0.6 |
| Leukemia | 2,806 | 16.5 | 1,617 | 20.3 | 1,189 | 13.1 |
| Liver | 1,731 | 9.8 | 1,198 | 14.5 | 533 | 5.6 |
| Lung | 10,639 | 58.9 | 5,077 | 61.2 | 5,562 | 57.5 |
| Melanoma | 4,724 | 27.9 | 2,738 | 34.4 | 1,986 | 22.8 |
| Myeloma | 1,777 | 10.1 | 1,066 | 13.1 | 711 | 7.5 |
| Non-Hodgkin lymphoma | 5,284 | 30.7 | 3,039 | 38.0 | 2,245 | 24.5 |
| Oral cavity and pharynx | 2,111 | 12.6 | 1,493 | 18.8 | 618 | 6.9 |
| Ovary | n/a | n/a | n/a | n/a | 1,350 | 15.7 |
| Pancreas | 2,643 | 14.8 | 1,425 | 17.5 | 1,218 | 12.6 |
| Prostate | n/a | n/a | 10,578 | 124.2 | n/a | n/a |
| Stomach | 1,809 | 10.4 | 1,181 | 14.7 | 628 | 6.8 |
| Testis | n/a | n/a | 541 | 7.1 | n/a | n/a |
| Thyroid | 3,461 | 22.6 | 1,004 | 13.2 | 2,457 | 31.8 |
| Uterus | n/a | n/a | n/a | n/a | 3,400 | 39.1 |
Abbreviations: ASIR means age-standardized incidence rate; n/a means not applicable.
Notes:
- Rates are per 100,000 and standardized to the age distribution of the 2011 Canadian Standard population.
- Projected incidence rates are based on the National Cancer lnstitute’s Surveillance, Epidemiology and End Results standards for counting multiple primary cancers, which were adopted by the Ontario Cancer Registry for cases diagnosed from 2010 onward.
- Projections are based on malignant cases only.
Analysis by: Surveillance, Ontario Health (Cancer Care Ontario)
Data source: Ontario Cancer Registry (March 2021), Ontario Health (Cancer Care Ontario)
Incidence by Age
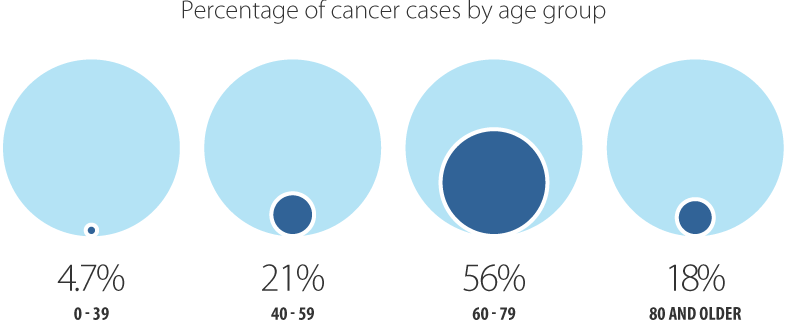
The greatest number of new cancer cases is expected in people ages 60 to 79. An estimated 56% of all cases in 2022 are projected to be diagnosed in this age group (Table 1.2). The age group with the second highest number of new cancer cases will be people ages 40 to 59 (21%), followed by those age 80 and older (18%). Only 4.7% of cases are expected to be diagnosed in people under age 40.
The incidence rate in 2022 is projected to range from 60.2 per 100,000 in people age 39 and younger to 2,518.4 per 100,000 in people age 80 and older. The projected rates for 2022 increase with advancing age for most cancers, except:
- cervical cancer, which increases with advancing age, but peaks in people ages 40 to 59
- oral and pharynx, prostate, thyroid and uterine cancers, which increase with advancing age, but peak in people ages 60 to 79
- testicular cancer, which decreases with advancing age
- Hodgkin lymphoma, which is highest in people age 39 and younger and in people age 80 and older
The incidence rates of the 23 cancers reported in Table 1.2 are projected to be very low in people under age 40. The exceptions are breast cancer at 16.7 per 100,000, testicular cancer at 10.0 per 100,000 and thyroid cancer at 8.9 per 100,000.
| Cancer type | Ages 0 to 39 - New cases | Ages 0 to 39 - Age-specific rate | Ages 40 to 59 - New cases | Ages 40 to 59 - Age-specific rate | Ages 60 to 79 -New cases | Ages 60 to 79 - Age-specific rate | Age 80 and older - New cases | Age 80 and older - Age-specific rate |
|---|---|---|---|---|---|---|---|---|
| All cancers | 4,504 | 60.2 | 19,887 | 514.1 | 53,530 | 1,733.1 | 17,404 | 2,518.4 |
| Bladder | 32 | 0.4 | 484 | 12.5 | 2,619 | 84.8 | 1,310 | 189.6 |
| Brain | 248 | 3.3 | 286 | 7.4 | 531 | 17.2 | 151 | 21.9 |
| Breast (female) | 609 | 16.7 | 4,104 | 208.1 | 6,189 | 383.3 | 1,629 | 397.1 |
| Cervix | 160 | 4.4 | 248 | 12.6 | 148 | 9.2 | 27 | 6.6 |
| Colorectal | 178 | 2.4 | 1,739 | 45 | 4,986 | 161.4 | 2,215 | 320.5 |
| Esophagus | 7 | 0.1 | 128 | 3.3 | 515 | 16.7 | 183 | 26.5 |
| Hodgkin lymphoma | 234 | 3.1 | 95 | 2.5 | 90 | 2.9 | 24 | 3.5 |
| Kidney | 136 | 1.8 | 892 | 23.1 | 1,764 | 56.5 | 424 | 61.4 |
| Larynx | ** | ** | 67 | 1.7 | 262 | 8.5 | 67 | 9.7 |
| Leukemia | 331 | 4.4 | 482 | 12.5 | 1,430 | 46.3 | 563 | 81.5 |
| Liver | 26 | 0.3 | 247 | 6.4 | 1,111 | 36.0 | 347 | 50.2 |
| Lung | 48 | 0.6 | 1,109 | 28.7 | 6,867 | 222.3 | 2,615 | 378.4 |
| Melanoma | 318 | 4.3 | 1,032 | 26.7 | 2,373 | 76.8 | 1,001 | 144.8 |
| Myeloma | 13 | 0.2 | 272 | 7.0 | 1,042 | 33.7 | 450 | 65.1 |
| Non-Hodgkin lymphoma | 332 | 4.4 | 974 | 25.2 | 2,827 | 91.5 | 1,151 | 166.6 |
| Oral cavity and pharynx | 53 | 0.7 | 578 | 14.9 | 1,212 | 39.2 | 268 | 38.8 |
| Ovary | 95 | 2.6 | 403 | 20.4 | 656 | 40.6 | 196 | 47.8 |
| Pancreas | 25 | 0.3 | 343 | 8.9 | 1,525 | 49.4 | 750 | 108.5 |
| Prostate | ** | ** | 1,365 | 72.0 | 8,123 | 551.0 | 1,089 | 387.8 |
| Stomach | 39 | 0.5 | 340 | 8.8 | 994 | 32.2 | 436 | 63.1 |
| Testis | 381 | 10.0 | 125 | 6.6 | 31 | 2.1 | ** | ** |
| Thyroid | 666 | 8.9 | 1,486 | 38.4 | 1,190 | 38.5 | 119 | 17.2 |
| Uterus | 74 | 2.0 | 1,017 | 51.6 | 1,982 | 122.8 | 327 | 79.7 |
Symbol: ** Suppressed due to small cell count (count less than 6).
Notes:
- Rates are per 100,000.
- Projected incidence rates are based on the National Cancer lnstitute’s Surveillance, Epidemiology and End Results standards for counting multiple primary cancers, which were adopted by the Ontario Cancer Registry for cases diagnosed from 2010 onward.
- Projections are based on malignant cases only.
Analysis by: Surveillance, Ontario Health (Cancer Care Ontario)
Data source: Ontario Cancer Registry (March, 2021), Ontario Health (Cancer Care Ontario)
Female breast cancer will account for the largest proportion of all cases among people ages 40 to 59 (20.6%). ln people ages 60 to 79, breast (11.6%), lung (12.8%) and prostate (15.2%) will be the most common cancers diagnosed. Among people age 80 and older, lung will be the most commonly diagnosed cancer (15.0%), followed by colorectal cancer (12.7%).
For more information on cancer incidence in Ontario, including data on more cancer types and trends over time, see Chapter 4: Cancer Incidence.