
Ontario Cancer Statistics 2022 Ch 4: Cancer Incidence
Cancer incidence refers to the number of new cancer cases diagnosed within a specific period. This chapter presents actual (non-projected) incidence rates and trends based on counts considered complete as of 2018, which is the latest available year.
What's on this page
From 1984 to 2018, population aging and growth have contributed far more to the number of new cancer cases than actual changes in cancer risk and cancer control practices (Figure 4.1).
In 2018, 84,816 new cancer cases were diagnosed in Ontario, representing a 157% increase since 1984 (33,004 cases). Of this 157% increase, approximately 84% is due to aging of the population, 62% is due to population growth and only 11% is due to changes in cancer risk and cancer control practices.
Probability of Developing Cancer
The lifetime probability of developing cancer refers to the average chance of being diagnosed with cancer over the course of a lifetime.
The probability of developing a specific type of cancer depends on many factors, including:
- a population’s characteristics (e.g., demographics)
- the prevalence of risk factors (e.g., age, family history of cancer, smoking, obesity)
- current life expectancy
In addition, the probabilities in this report reflect the average risks for the overall population and do not consider personal risk factors. In other words, an individual’s risk may be higher or lower than the numbers reported here.
In Ontario, nearly 1 in 2 people will develop cancer in their lifetime.
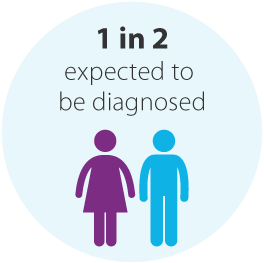
In Ontario, nearly 1 in 2 people (44.3%) will develop cancer in their lifetime (not including non-melanoma skin cancer) (Table 4.1). The probability of developing cancer was lower for females than for males and varied based on cancer type:
- Among males, the probability was highest for prostate (1 in 9 males), lung (1 in 17) and colorectal (1 in 20) cancers.
- Among females, the probability was highest for breast (1 in 9 females), lung (1 in 18) and colorectal (1 in 23) cancers.
| Cancer type | Males and females combined % |
Males and females combined 1 in |
Males % |
Males 1 in |
Females % |
Females 1 in |
|---|---|---|---|---|---|---|
| All cancers | 44.3% | 2 | 45.8% | 2 | 43.0% | 2 |
| Bladder | 2.4% | 42 | 3.7% | 27 | 1.2% | 87 |
| Brain | 0.6% | 163 | 0.7% | 144 | 0.5% | 186 |
| Breast (female) | n/a | n/a | n/a | n/a | 11.1% | 9 |
| Cervix | n/a | n/a | n/a | n/a | 0.5% | 212 |
| Colorectal | 4.7% | 21 | 5.1% | 20 | 4.4% | 23 |
| Esophagus | 0.4% | 241 | 0.6% | 165 | 0.2% | 434 |
| Hodgkin lymphoma | 0.2% | 459 | 0.2% | 429 | 0.2% | 491 |
| Kidney | 1.2% | 84 | 1.6% | 64 | 0.8% | 121 |
| Larynx | 0.2% | 473 | 0.4% | 273 | 0.1% | 1,556 |
| Leukemia | 1.4% | 71 | 1.6% | 61 | 1.2% | 86 |
| Liver | 0.8% | 127 | 1.1% | 93 | 0.5% | 198 |
| Lung | 5.7% | 18 | 5.9% | 17 | 5.6% | 18 |
| Melanoma | 1.8% | 56 | 2.0% | 49 | 1.5% | 65 |
| Myeloma | 0.9% | 117 | 1.0% | 105 | 0.8% | 132 |
| Non-Hodgkin lymphoma | 2.4% | 42 | 2.6% | 38 | 2.1% | 47 |
| Oral cavity and pharynx | 0.9% | 115 | 1.2% | 83 | 0.5% | 183 |
| Ovary | n/a | n/a | n/a | n/a | 1.3% | 78 |
| Pancreas | 1.2% | 80 | 1.3% | 80 | 1.2% | 81 |
| Prostate | n/a | n/a | 10.7% | 9 | n/a | n/a |
| Stomach | 0.9% | 115 | 1.1% | 90 | 0.6% | 156 |
| Testis | n/a | n/a | 0.4% | 231 | n/a | n/a |
| Thyroid | 1.5% | 68 | 0.7% | 134 | 2.2% | 45 |
| Uterus | n/a | n/a | n/a | n/a | 2.9% | 34 |
Abbreviation: n/a means not applicable.
Analysis by: Surveillance, Ontario Health (Cancer Care Ontario)
Data source: Ontario Cancer Registry (March 2021), Ontario Health (Cancer Care Ontario). Statistics Canada, Table 13-10-0710-01 Mortality rates, by age group.
Incidence by Sex and Cancer Type
In 2018, 84,816 new cancer cases were diagnosed in Ontario for an age-standardized incidence rate of 543.1 per 100,000 (Table 4.2).
| Cancer type | Males and females combined | Males | Females | |||||||||
|---|---|---|---|---|---|---|---|---|---|---|---|---|
| New cases | % of cases | ASIR | ASIR 95% CI | New cases | % of cases | ASIR | ASIR 95% CI | New cases | % of cases | ASIR | ASIR 95% CI | |
| All cancers | 84,816 | 100% | 543.1 | 539.5-546.8 | 42,630 | 100% | 582.0 | 576.5-587.6 | 42,186 | 100% | 516.8 | 511.8-521.8 |
| Brain and nervous system | ||||||||||||
| Brain and other nervous system - malignant | 1,193 | 1.4% | 7.9 | 7.5-8.4 | 683 | 1.6% | 9.6 | 8.9-10.3 | 510 | 1.2% | 6.4 | 5.9-7.0 |
| Glioblastoma | 595 | 0.7% | 3.9 | 3.5-4.2 | 346 | 0.8% | 4.8 | 4.3-5.3 | 249 | 0.6% | 3.0 | 2.7-3.4 |
| All other gliomas | 326 | 0.4% | 2.3 | 2.0-2.5 | 182 | ** | 3 | 2.2-3.0 | 144 | ** | 2 | 1.7-2.3 |
| Brain and other nervous system - non-malignant | 2,349 | 2.8% | 15.7 | 15.1-16.3 | 977 | 2.3% | 13.8 | 12.9-14.7 | 1,372 | 3.3% | 17.5 | 16.6-18.5 |
| Meningiomas | 629 | 0.7% | 4.2 | 3.9-4.6 | 183 | 0.4% | 2.6 | 2.2-3.0 | 446 | 1.1% | 5.8 | 5.3-6.4 |
| Pituitary, pineal and craniopharyngeal duct | 530 | 0.6% | 3.6 | 3.3-3.9 | 266 | 0.6% | 3.7 | 3.3-4.2 | 264 | 0.6% | 3.5 | 3.1-3.9 |
| Breast and genital system | ||||||||||||
| Breast (female) | n/a | n/a | n/a | n/a | n/a | n/a | n/a | n/a | 11,728 | 27.8% | 147.4 | 144.7-150.1 |
| Cervix | n/a | n/a | n/a | n/a | n/a | n/a | n/a | n/a | 620 | 1.5% | 8.4 | 7.8-9.1 |
| Ovary | n/a | n/a | n/a | n/a | n/a | n/a | n/a | n/a | 1,293 | 3.1% | 16.2 | 15.3-17.1 |
| Prostate | n/a | n/a | n/a | n/a | 9,734 | 22.8% | 128.9 | 126.4-131.5 | n/a | n/a | n/a | n/a |
| Testis | n/a | n/a | n/a | n/a | 536 | 1.3% | 7.6 | 7.0-8.3 | n/a | n/a | n/a | n/a |
| Uterus | n/a | n/a | n/a | n/a | n/a | n/a | n/a | n/a | 3,153 | 7.5% | 39.2 | 37.9-40.7 |
| Uterus - endometrial | n/a | n/a | n/a | n/a | n/a | n/a | n/a | n/a | 2,909 | 6.9% | 36.2 | 34.8-37.5 |
| Uterus - uterine sarcoma | n/a | n/a | n/a | n/a | n/a | n/a | n/a | n/a | 81 | 0.2% | 1.1 | 0.9-1.4 |
| Digestive system | ||||||||||||
| Colorectal | 8,398 | 9.9% | 53.5 | 52.3-54.6 | 4,609 | 10.8% | 63.8 | 61.9-65.6 | 3,789 | 9.0% | 44.8 | 43.3-46.2 |
| Colon excluding rectum | 5,541 | 6.5% | 35.0 | 34.1-35.9 | 2,848 | 6.7% | 39.4 | 38.0-40.9 | 2,693 | 6.4% | 31.3 | 30.1-32.5 |
| Colon - left sided | 1,935 | 2.3% | 12.4 | 11.9-13.0 | 1,089 | 2.6% | 14.9 | 14.1-15.9 | 846 | 2.0% | 10.4 | 9.7-11.1 |
| Colon - right sided | 3,305 | 3.9% | 20.7 | 20.0-21.4 | 1,620 | 3.8% | 22.4 | 21.4-23.6 | 1,685 | 4.0% | 19.2 | 18.3-20.2 |
| Rectum and rectosigmoid junction | 2,836 | 3.3% | 18.4 | 17.7-19.1 | 1,751 | 4.1% | 24.2 | 23.1-25.4 | 1,085 | 2.6% | 13.3 | 12.6-14.2 |
| Rectosigmoid junction | 705 | 0.8% | 4.5 | 4.2-4.9 | 415 | 1.0% | 5.7 | 5.2-6.3 | 290 | 0.7% | 3.6 | 3.2-4.0 |
| Rectum | 2,131 | 2.5% | 13.8 | 13.2-14.4 | 1,336 | 3.1% | 18.5 | 17.5-19.5 | 795 | 1.9% | 9.8 | 9.1-10.5 |
| Esophagus | 924 | 1.1% | 5.8 | 5.5-6.2 | 693 | 1.6% | 9.5 | 8.8-10.2 | 231 | 0.5% | 2.7 | 2.3-3.0 |
| Esophagus - adenocarcinoma | 522 | 0.6% | 3.3 | 3.0-3.6 | 459 | 1.1% | 6.3 | 5.7-6.9 | 63 | 0.1% | 0.7 | 0.6-0.9 |
| Esophagus - squamous cell carcinoma | 281 | 0.3% | 1.8 | 1.6-2.0 | 156 | 0.4% | 2.1 | 1.8-2.5 | 125 | 0.3% | 1.4 | 1.2-1.7 |
| Liver | 1,321 | 1.6% | 8.3 | 7.8-8.7 | 907 | 2.1% | 12.3 | 11.5-13.1 | 414 | 1.0% | 4.8 | 4.3-5.3 |
| Pancreas | 2,059 | 2.4% | 12.8 | 12.3-13.4 | 1,070 | 2.5% | 14.6 | 13.7-15.5 | 989 | 2.3% | 11.3 | 10.6-12.1 |
| Stomach | 1,669 | 2.0% | 10.6 | 10.1-11.1 | 1,070 | 2.5% | 14.7 | 13.8-15.6 | 599 | 1.4% | 7.1 | 6.5-7.7 |
| Head and neck | ||||||||||||
| Larynx | 412 | 0.5% | 2.6 | 2.4-2.9 | 359 | 0.8% | 4.9 | 4.4-5.4 | 53 | 0.1% | 0.6 | 0.5-0.8 |
| Oral cavity and pharynx | 1,870 | 2.2% | 12.1 | 11.5-12.6 | 1,342 | 3.1% | 18.3 | 17.3-19.3 | 528 | 1.3% | 6.4 | 5.9-7.0 |
| Lip and oral cavity | 920 | 1.1% | 5.9 | 5.5-6.3 | 575 | 1.3% | 7.9 | 7.2-8.5 | 345 | 0.8% | 4.1 | 3.7-4.6 |
| Hypopharynx | 78 | 0.1% | 0.5 | 0.4-0.6 | 70 | 0.2% | 0.9 | 0.7-1.2 | 8 | 0.0% | 0.1 | 0.0-0.2 |
| Nasopharynx | 107 | 0.1% | 0.7 | 0.6-0.9 | 82 | 0.2% | 1.1 | 0.9-1.4 | 25 | 0.1% | 0.4 | 0.2-0.5 |
| Oropharynx | 700 | 0.8% | 4.5 | 4.2-4.9 | 572 | 1.3% | 7.7 | 7.1-8.4 | 128 | 0.3% | 1.6 | 1.3-1.9 |
| Thyroid | 3,070 | 3.6% | 21.4 | 20.6-22.1 | 828 | 1.9% | 11.7 | 10.9-12.6 | 2,242 | 5.3% | 30.7 | 29.5-32.1 |
| Thyroid - anaplastic | 25 | 0.0% | 0.2 | 0.1-0.2 | 13 | 0.0% | 0.2 | 0.1-0.3 | 12 | 0.0% | 0.1 | 0.1-0.2 |
| Thyroid - follicular | 136 | 0.2% | 0.9 | 0.8-1.1 | 37 | 0.1% | 0.5 | 0.4-0.7 | 99 | 0.2% | 1.3 | 1.1-1.6 |
| Thyroid - medullary | 35 | 0.0% | 0.2 | 0.2-0.3 | 15 | 0.0% | 0.2 | 0.1-0.4 | 20 | 0.0% | 0.3 | 0.2-0.4 |
| Thyroid - papillary | 2,789 | 3.3% | 19.5 | 18.8-20.2 | 726 | 1.7% | 10.3 | 9.6-11.1 | 2,063 | 4.9% | 28.4 | 27.2-29.7 |
| Hematological | ||||||||||||
| Leukemia | 2,417 | 2.8% | 15.6 | 15.0-16.2 | 1,440 | 3.4% | 19.9 | 18.9-21.0 | 977 | 2.3% | 11.9 | 11.1-12.7 |
| Acute lymphocytic leukemia | 216 | 0.3% | 1.5 | 1.3-1.7 | 122 | 0.3% | 1.7 | 1.4-2.1 | 94 | 0.2% | 1.3 | 1.1-1.6 |
| Acute monocytic leukemia | 934 | 1.1% | 5.9 | 5.5-6.3 | 589 | 1.4% | 8.0 | 7.4-8.7 | 345 | 0.8% | 4.0 | 3.6-4.5 |
| Acute myeloid leukemia | 26 | 0.0% | 0.2 | 0.1-0.2 | 11 | 0.0% | 0.1 | 0.1-0.3 | 15 | 0.0% | 0.2 | 0.1-0.3 |
| Chronic lymphocytic leukemia | 662 | 0.8% | 4.3 | 3.9-4.6 | 347 | 0.8% | 4.8 | 4.3-5.3 | 315 | 0.7% | 3.9 | 3.4-4.3 |
| Chronic myeloid leukemia | 327 | 0.4% | 2.1 | 1.9-2.4 | 213 | 0.5% | 3.0 | 2.6-3.4 | 114 | 0.3% | 1.4 | 1.2-1.7 |
| Lymphoma | 4,703 | 5.5% | 30.2 | 29.4-31.1 | 2,570 | 6.0% | 35.5 | 34.2-36.9 | 2,133 | 5.1% | 25.8 | 24.7-26.9 |
| Hodgkin lymphoma | 420 | 0.5% | 2.9 | 2.6-3.2 | 210 | 0.5% | 3.0 | 2.6-3.4 | 210 | 0.5% | 2.8 | 2.5-3.3 |
| Non-Hodgkin lymphoma | 4,283 | 5.0% | 27.3 | 26.5-28.2 | 2,360 | 5.5% | 32.6 | 31.3-33.9 | 1,923 | 4.6% | 22.9 | 21.9-24.0 |
| Non-Hodgkin lymphoma - extranodal | 2,085 | 2.5% | 13.3 | 12.7-13.9 | 1,174 | 2.8% | 16.1 | 15.2-17.1 | 911 | 2.2% | 10.9 | 10.2-11.6 |
| Non-Hodgkin lymphoma - nodal | 2,198 | 2.6% | 14.0 | 13.5-14.6 | 1,186 | 2.8% | 16.5 | 15.5-17.4 | 1,012 | 2.4% | 12.0 | 11.3-12.8 |
| Myeloma | 1,468 | 1.7% | 9.2 | 8.8-9.7 | 840 | 2.0% | 11.5 | 10.8-12.4 | 628 | 1.5% | 7.3 | 6.7-7.9 |
| Melanoma | ||||||||||||
| Melanoma of the skin | 3,882 | 4.6% | 25.2 | 24.4-26.0 | 2,161 | 5.1% | 29.9 | 28.7-31.2 | 1,721 | 4.1% | 21.4 | 20.4-22.4 |
| Melanoma (non-cutaneous) | 175 | 0.2% | 1.1 | 1.0-1.3 | 97 | 0.2% | 1.3 | 1.1-1.6 | 78 | 0.2% | 1.0 | 0.8-1.2 |
| Melanoma - mucosal | 56 | 0.1% | 0.3 | 0.3-0.5 | 20 | 0.0% | 0.3 | 0.2-0.4 | 36 | 0.1% | 0.4 | 0.3-0.6 |
| Melanoma - ocular | 119 | 0.1% | 0.8 | 0.6-0.9 | 77 | 0.2% | 1.1 | 0.8-1.3 | 42 | 0.1% | 0.5 | 0.4-0.7 |
| Thoracic system | ||||||||||||
| Lung | 10,337 | 12.2% | 64.1 | 62.8-65.3 | 5,060 | 11.9% | 68.6 | 66.7-70.6 | 5,277 | 12.5% | 61.1 | 59.5-62.8 |
| Lung - adenocarcinoma | 3,924 | 4.6% | 24.5 | 23.7-25.2 | 1,784 | 4.2% | 24.1 | 23.0-25.2 | 2,140 | 5.1% | 25.1 | 24.0-26.2 |
| Lung - large cell | 132 | 0.2% | 0.8 | 0.7-1.0 | 68 | 0.2% | 0.9 | 0.7-1.2 | 64 | 0.2% | 0.8 | 0.6-1.0 |
| Lung - small cell | 1,009 | 1.2% | 6.3 | 5.9-6.7 | 505 | 1.2% | 6.8 | 6.2-7.4 | 504 | 1.2% | 5.9 | 5.4-6.5 |
| Lung - squamous cell | 1,601 | 1.9% | 9.9 | 9.4-10.4 | 1,001 | 2.3% | 13.5 | 12.7-14.4 | 600 | 1.4% | 6.9 | 6.3-7.5 |
| Urinary system | ||||||||||||
| Bladder | 4,115 | 4.9% | 25.6 | 24.9-26.4 | 3,158 | 7.4% | 43.6 | 42.1-45.1 | 957 | 2.3% | 11.0 | 10.3-11.7 |
| Kidney | 2,609 | 3.1% | 16.9 | 16.3-17.6 | 1,707 | 4.0% | 23.3 | 22.2-24.5 | 902 | 2.1% | 11.1 | 10.4-11.8 |
Abbreviations: ASIR means age-standardized incidence rate; CI means confidence interval.
Notes:
- Rates are per 100,000 and standardized to the age distribution of the 2011 Canadian Standard population.
- Only selected subsites and histological subtypes of major cancers are shown. As a result, counts for the subsites and subtypes shown may not add up to the total for each cancer.
Analysis by: Surveillance, Ontario Health (Cancer Care Ontario)
Data source: Ontario Cancer Registry (March 2021), Ontario Health (Cancer Care Ontario)
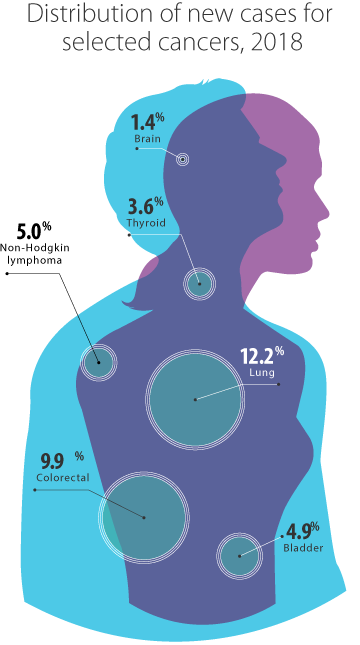
The 4 most commonly diagnosed cancers (breast, colorectal, lung and prostate) were responsible for almost 50% of all new cancer cases in 2018. Lung, colorectal and prostate cancers accounted for 46% of new cases among males, while lung, breast and colorectal cancers accounted for 49% of new cases among females (Figure 4.2).
Non-melanoma skin cancers represent the most common type of cancer in most jurisdictions, but they are not included in this report because Ontario does not routinely collect data about them. Other jurisdictions have reported an increasing trend in non-melanoma skin cancers.[1–3]
In 2018, the highest age-standardized incidence rates for cancers occurring in males and females were for lung cancer (64.1 per 100,000), colorectal cancer (53.5 per 100,000) and lymphoma (30.2 per 100,000).
The age-standardized incidence rates for all cancers combined was significantly higher in males (582.0 per 100,000) than in females (516.8 per 100,000) (Table 4.2).
- In males, the most commonly diagnosed cancers were prostate (9,734, or 22.8% of all new male cases), lung (5,060, or 11.9%) and colorectal (4,609, or 10.8%).
- In females, the leading cancer types were breast (11,728, or 27.8% of all new female cases), lung (5,277, or 12.5%) and colorectal (3,789, or 9.0%).
The greatest differences in incidence between males and females were for laryngeal, bladder, esophageal, oral cavity and pharynx, liver, kidney and stomach cancers. The risk of each of these cancer types is associated with the use of tobacco or alcohol [4,5] and in Ontario, tobacco and alcohol use are more prevalent among men.[6]
- Laryngeal cancer: The male rate was over 8 times higher than the female rate. Smokers are 7 times more likely to develop laryngeal cancer [7] and heavy alcohol use more than doubles laryngeal cancer risk.[4]
- Bladder cancer: The male rate was nearly 4 times higher than the female rate. One of the main risk factors for bladder cancer is smoking, with smokers being 2 to 3 times more likely to develop bladder cancer than non-smokers.[8,9]
- Esophageal cancer: The male rate for esophageal cancer overall was more than 3 times higher than the female rate, with the rate of adenocarcinoma of the esophagus being 9 times higher in males than in females. Smoking more than doubles the risk of esophageal cancer.[7] Alcohol use and obesity – also more common in males – are other risk factors for esophageal cancer.[10]
- Oral cavity and pharynx cancer: The male rate for oral cavity and pharynx cancer overall was almost 3 times higher than the female rate, with the rate of oropharynx cancers in males being nearly 5 times higher than in females. Tobacco and alcohol use are risk factors for oral cavity and pharynx cancer.[11] Alcohol use increases the risk of this cancer by more than 5 times.[4]
- Liver cancer: The male rate was more than double the female rate. Tobacco and alcohol use are linked to increased risk of liver cancer.[4] Chronic viral hepatitis is another risk factor for liver cancer.[12]
- Kidney cancer: The male rate was double the female rate. Heavy alcohol use is associated with increased risk of kidney cancer.[4]
- Stomach cancer: The male rate was double the female rate. Heavy alcohol use is associated with a 20% increase in risk of stomach cancer.[4]
The incidence rate was higher in males than females for almost all cancers. One exception was thyroid cancer, which had an age-standardized incidence rate for females of 30.7 per 100,000, compared with just 11.7 per 100,000 for males. A number of possible reasons for the higher thyroid cancer incidence in females have been proposed, including:
- a greater likelihood of diagnostic investigation among females because they are more likely to have thyroid disease [13], and they have a greater tendency to seek medical attention and participate more actively in medical visits [14–16]
- the differences in hormone levels of males and females (such as thyroid stimulated hormone and sex steroids) [17–19]
While the incidence of less aggressive types of thyroid cancer, such as papillary carcinoma, was higher for females than males in Ontario (Table 4.2), the rates of more aggressive types, such as anaplastic and medullary thyroid cancers, were generally similar for males and females. The same pattern is seen in other jurisdictions. [13,20]
The incidence rates of non-malignant tumours of the brain and nervous system were higher in females than males. Although the higher rate of non-malignant brain tumours in females has also been seen in many other jurisdictions [21–24], the reason for these sex differences is not clear.
Incidence by Age
From 2016 to 2018, the median age at cancer diagnosis was 69 for males and 66 for females (Table 4.3). The median age at diagnosis varied by cancer type. Of the 23 cancer types, cancers with the lowest median age (all under age 50) were testis, Hodgkin lymphoma and cervix.
From 2016 to 2018, the median age at cancer diagnosis was 69 for males and 66 for females.
Among children, the cancer types with the lowest median age at diagnosis from 2016 to 2020 were neuroblastoma, retinoblastoma and hepatic tumours. In addition during this time period, neuroblastoma, leukemias and central nervous system tumours were the most common types of cancer in children under age 1.
For more details on childhood cancer incidence, see Spotlight: Childhood Cancer Incidence, Table 4.S1 or read the Pediatric Oncology Group of Ontario Surveillance Report.
The median age at diagnosis for most cancer types was above age 60, with a few exceptions.
| Cancer type | Males and females combined Age (years) |
Males Age (years) |
Females Age (years) |
|---|---|---|---|
| All cancers | 68 | 69 | 66 |
| Bladder | 73 | 73 | 73 |
| Brain | 61 | 61 | 62 |
| Breast (female) | n/a | n/a | 63 |
| Cervix | n/a | n/a | 48 |
| Colorectal | 70 | 69 | 72 |
| Esophagus | 69 | 68 | 72 |
| Hodgkin lymphoma | 38 | 39 | 37 |
| Kidney | 65 | 65 | 65 |
| Larynx | 68 | 68 | 68 |
| Leukemia | 68 | 68 | 68 |
| Liver | 69 | 68 | 73 |
| Lung | 71 | 72 | 71 |
| Melanoma | 66 | 68 | 64 |
| Myeloma | 72 | 71 | 72 |
| Non-Hodgkin lymphoma | 69 | 68 | 69 |
| Oral cavity and pharynx | 64 | 64 | 67 |
| Ovary | n/a | n/a | 64 |
| Pancreas | 72 | 70 | 73 |
| Prostate | n/a | 68 | n/a |
| Stomach | 70 | 70 | 71 |
| Testis | n/a | 34 | n/a |
| Thyroid | 52 | 55 | 51 |
| Uterus | n/a | n/a | 64 |
Abbreviation: n/a means not applicable.
Analysis by: Surveillance, Ontario Health (Cancer Care Ontario)
Data source: Ontario Cancer Registry (March 2021), Ontario Health (Cancer Care Ontario)
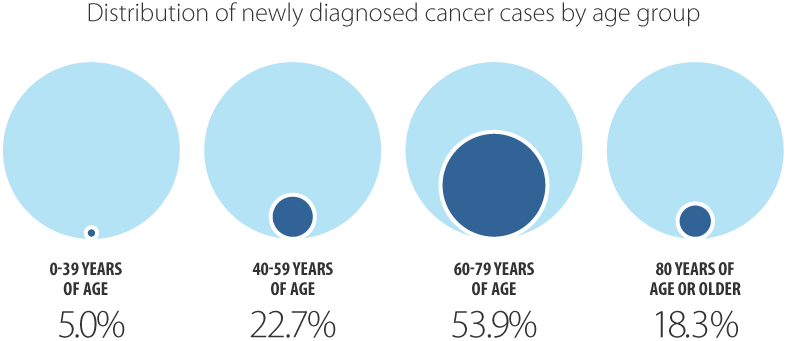
In 2018, more than half of all newly diagnosed cancer cases were in people ages 60 to 79 (Table 4.4). The distribution of cancer types by age group varied widely.
| Cancer type | Ages 0 to 39 | Ages 40 to 59 | Ages 60 to 79 | Age 80 and older | ||||||||
|---|---|---|---|---|---|---|---|---|---|---|---|---|
| New cases | Age-specific rate | 95 % CI | New cases | Age-specific rate | 95 % CI | New cases | Age-specific rate | 95 % CI | New cases | Age-specific rate | 95 % CI | |
| All cancers | 4,300 | 61.0 | 59.2-62.9 | 19,262 | 490.7 | 483.8-497.6 | 45,726 | 1,686.1 | 1,670.7-1,701.6 | 15,528 | 2,486.2 | 2,447.2-2,525.6 |
| Brain and nervous system | ||||||||||||
| Brain and other nervous system - malignant* | 257 | 3.6 | 3.2-4.1 | 290 | 7.4 | 6.6-8.3 | 485 | 17.9 | 16.3-19.5 | 161 | 25.8 | 21.9-30.1 |
| Glioblastoma | 35 | 0.5 | 0.3-0.7 | 155 | 3.9 | 3.4-4.6 | 337 | 12.4 | 11.1-13.8 | 68 | 10.9 | 8.5-13.8 |
| All other gliomas | 157 | 2.2 | 1.9-2.6 | 99 | 2.5 | 2.0-3.1 | 60 | 2.2 | 1.7-2.8 | 10 | 1.6 | 0.8-2.9 |
| Brain and other nervous system - non-malignant* | 378 | 5.4 | 4.8-5.9 | 749 | 19.1 | 17.7-20.5 | 854 | 31.5 | 29.4-33.7 | 368 | 58.9 | 53.1-65.3 |
| Meningiomas | 47 | 0.7 | 0.5-0.9 | 269 | 6.9 | 6.1-7.7 | 264 | 9.7 | 8.6-11.0 | 49 | 7.8 | 5.8-10.4 |
| Pituitary, pineal and craniopharyngeal duct | 111 | 1.6 | 1.3-1.9 | 182 | 4.6 | 4.0-5.4 | 178 | 6.6 | 5.6-7.6 | 59 | 9.4 | 7.2-12.2 |
| Breast and genital system | ||||||||||||
| Breast (female) | 542 | 15.7 | 14.4-17.1 | 4,057 | 203.6 | 197.4-210.0 | 5,602 | 394.3 | 384.0-404.7 | 1,527 | 406.2 | 386.1-427.1 |
| Cervix | 187 | 5.4 | 4.7-6.2 | 254 | 12.7 | 11.2-14.4 | 150 | 10.6 | 8.9-12.4 | 29 | 7.7 | 5.2-11.1 |
| Ovary | 101 | 2.9 | 2.4-3.5 | 404 | 20.3 | 18.3-22.4 | 597 | 42.0 | 38.7-45.5 | 191 | 50.8 | 43.9-58.6 |
| Prostate | ** | ** | ** | 1520† | 78.6 | 74.7-82.7 | 6,957 | 538.8 | 526.2-551.6 | 1,254 | 504.2 | 476.7-532.9 |
| Testis | 363 | 10.1 | 9.1-11.2 | 144 | 7.4 | 6.3-8.8 | 25 | 1.9 | 1.3-2.9 | ** | ** | ** |
| Uterus | 75 | 2.2 | 1.7-2.7 | 1,016 | 51.0 | 47.9-54.2 | 1,794 | 126.3 | 120.5-132.2 | 268 | 71.3 | 63.0-80.4 |
| Uterus - endometrial | 64 | 1.9 | 1.4-2.4 | 917 | 46.0 | 43.1-49.1 | 1,702 | 119.8 | 114.2-125.6 | 226 | 60.1 | 52.5-68.5 |
| Uterus - uterine sarcoma | ** | ** | ** | 52 | 2.6 | 1.9-3.4 | 22 | 1.5 | 1.0-2.3 | ** | ** | ** |
| Digestive system | ||||||||||||
| Colorectal | 185 | 2.6 | 2.3-3.0 | 1,800 | 45.9 | 43.8-48.0 | 4,263 | 157.2 | 152.5-162.0 | 2,150 | 344.2 | 329.8-359.1 |
| Colon excluding rectum* | 86 | 1.2 | 1.0-1.5 | 980 | 25.0 | 23.4-26.6 | 2,850 | 105.1 | 101.3-109.0 | 1,625 | 260.2 | 247.7-273.1 |
| Colon - left sided | 44 | 0.6 | 0.5-0.8 | 497 | 12.7 | 11.6-13.8 | 1,015 | 37.4 | 35.2-39.8 | 379 | 60.7 | 54.7-67.1 |
| Colon - right sided* | 39 | 0.6 | 0.4-0.8 | 456 | 11.6 | 10.6-12.7 | 1,730 | 63.8 | 60.8-66.9 | 1,080 | 172.9 | 162.8-183.5 |
| Rectum and rectosigmoid junction | 99 | 1.4 | 1.1-1.7 | 820 | 20.9 | 19.5-22.4 | 1,405 | 51.8 | 49.1-54.6 | 512 | 82.0 | 75.0-89.4 |
| Rectosigmoid junction | 13 | 0.2 | 0.1-0.3 | 184 | 4.7 | 4.0-5.4 | 362 | 13.3 | 12.0-14.8 | 146 | 23.4 | 19.7-27.5 |
| Rectum | 86 | 1.2 | 1.0-1.5 | 636 | 16.2 | 15.0-17.5 | 1,043 | 38.5 | 36.2-40.9 | 366 | 58.6 | 52.7-64.9 |
| Esophagus | 6 | 0.1 | 0.0-0.2 | 182 | 4.6 | 4.0-5.4 | 539 | 19.9 | 18.2-21.6 | 197 | 31.5 | 27.3-36.3 |
| Esophagus - adenocarcinoma | ** | ** | ** | 115† | 2.9 | 2.4-3.5 | 300 | 11.1 | 9.8-12.4 | 104 | 16.7 | 13.6-20.2 |
| Esophagus - squamous cell carcinoma | ** | ** | ** | 45† | 1.1 | 0.8-1.5 | 174 | 6.4 | 5.5-7.4 | 60 | 9.6 | 7.3-12.4 |
| Liver | 24 | 0.3 | 0.2-0.5 | 222 | 5.7 | 4.9-6.4 | 796 | 29.4 | 27.3-31.5 | 279 | 44.7 | 39.6-50.2 |
| Pancreas | 20 | 0.3 | 0.2-0.4 | 308 | 7.8 | 7.0-8.8 | 1,172 | 43.2 | 40.8-45.8 | 559 | 89.5 | 82.2-97.2 |
| Stomach | 31 | 0.4 | 0.3-0.6 | 325 | 8.3 | 7.4-9.2 | 919 | 33.9 | 31.7-36.2 | 394 | 63.1 | 57.0-69.6 |
| Head and neck | ||||||||||||
| Larynx | ** | ** | ** | 95† | 2.4 | 2.0-3.0 | 237 | 8.7 | 7.7-9.9 | 74 | 11.8 | 9.3-14.9 |
| Oral cavity and pharynx | 43 | 0.6 | 0.4-0.8 | 550 | 14.0 | 12.9-15.2 | 1,041 | 38.4 | 36.1-40.8 | 236 | 37.8 | 33.1-42.9 |
| Hypopharynx | 27 | 0.4 | 0.3-0.6 | 229 | 5.8 | 5.1-6.6 | 502 | 18.5 | 16.9-20.2 | 162 | 25.9 | 22.1-30.3 |
| Lip and oral cavity | ** | ** | ** | 20† | 0.5 | 0.3-0.8 | 50 | 1.8 | 1.4-2.4 | 7 | 1.1 | 0.5-2.3 |
| Nasopharynx | 11 | 0.2 | 0.1-0.3 | 46 | 1.2 | 0.9-1.6 | 44 | 1.6 | 1.2-2.2 | 6 | 1.0 | 0.4-2.1 |
| Oropharynx | ** | ** | ** | 230† | 5.9 | 5.1-6.7 | 415 | 15.3 | 13.9-16.8 | 53 | 8.5 | 6.4-11.1 |
| Thyroid | 694 | 9.8 | 9.1-10.6 | 1,378 | 35.1 | 33.3-37.0 | 888 | 32.7 | 30.6-35.0 | 110 | 17.6 | 14.5-21.2 |
| Thyroid - anaplastic | ** | ** | ** | ** | ** | ** | 19 | 0.7 | 0.4-1.1 | ** | ** | ** |
| Thyroid - follicular | 19 | 0.3 | 0.2-0.4 | 56 | 1.4 | 1.1-1.9 | 51 | 1.9 | 1.4-2.5 | 10 | 1.6 | 0.8-2.9 |
| Thyroid - medullary | ** | ** | ** | 16 | 0.4 | 0.2-0.7 | 13 | 0.5 | 0.3-0.8 | ** | ** | ** |
| Thyroid - papillary | 659 | 9.4 | 8.7-10.1 | 1,291 | 32.9 | 31.1-34.7 | 763 | 28.1 | 26.2-30.2 | 76 | 12.2 | 9.6-15.2 |
| Hematological | ||||||||||||
| Leukemia* | 292 | 4.1 | 3.7-4.6 | 463 | 11.8 | 10.7-12.9 | 1,191 | 43.9 | 41.5-46.5 | 471 | 75.4 | 68.8-82.5 |
| Acute lymphocytic leukemia | 154 | 2.2 | 1.9-2.6 | 23 | 0.6 | 0.4-0.9 | 33 | 1.2 | 0.8-1.7 | 6 | 1.0 | 0.4-2.1 |
| Acute monocytic leukemia | 8 | 0.1 | 0.0-0.2 | 184 | 4.7 | 4.0-5.4 | 555 | 20.5 | 18.8-22.2 | 187 | 29.9 | 25.8-34.6 |
| Acute myeloid leukemia* | ** | ** | ** | 6 | 0.2 | 0.1-0.3 | 15 | 0.6 | 0.3-0.9 | ** | ** | ** |
| Chronic lymphocytic leukemia | 63 | 0.9 | 0.7-1.1 | 125 | 3.2 | 2.7-3.8 | 342 | 12.6 | 11.3-14.0 | 132 | 21.1 | 17.7-25.1 |
| Chronic myeloid leukemia* | 38 | 0.5 | 0.4-0.7 | 77 | 2.0 | 1.5-2.5 | 147 | 5.4 | 4.6-6.4 | 65 | 10.4 | 8.0-13.3 |
| Lymphoma* | 469 | 6.7 | 6.1-7.3 | 982 | 25.0 | 23.5-26.6 | 2,361 | 87.1 | 83.6-90.6 | 891 | 142.7 | 133.4-152.3 |
| Hodgkin lymphoma | 224 | 3.2 | 2.8-3.6 | 93 | 2.4 | 1.9-2.9 | 82 | 3.0 | 2.4-3.8 | 21 | 3.4 | 2.1-5.1 |
| Non-Hodgkin lymphoma | 245 | 3.5 | 3.1-3.9 | 889 | 22.6 | 21.2-24.2 | 2,279 | 84.0 | 80.6-87.6 | 870 | 139.3 | 130.2-148.9 |
| Non-Hodgkin lymphoma - extranodal* | 109 | 1.5 | 1.3-1.9 | 436 | 11.1 | 10.1-12.2 | 1,190 | 43.9 | 41.4-46.4 | 350 | 56.0 | 50.3-62.2 |
| Non-Hodgkin lymphoma - nodal | 136 | 1.9 | 1.6-2.3 | 453 | 11.5 | 10.5-12.7 | 1,089 | 40.2 | 37.8-42.6 | 520 | 83.3 | 76.3-90.7 |
| Myeloma | 14 | 0.2 | 0.1-0.3 | 238 | 6.1 | 5.3-6.9 | 815 | 30.1 | 28.0-32.2 | 401 | 64.2 | 58.1-70.8 |
| Melanoma | ||||||||||||
| Melanoma of the skin | 268 | 3.8 | 3.4-4.3 | 1,032 | 26.3 | 24.7-27.9 | 1,895 | 69.9 | 66.8-73.1 | 687 | 110.0 | 101.9-118.5 |
| Melanoma (non-cutaneous) | 11 | 0.2 | 0.1-0.3 | 51 | 1.3 | 1.0-1.7 | 88 | 3.2 | 2.6-4.0 | 25 | 4.0 | 2.6-5.9 |
| Melanoma - mucosal | ** | ** | ** | 10† | 0.3 | 0.1-0.5 | 34 | 1.3 | 0.9-1.8 | 12 | 1.9 | 1.0-3.4 |
| Melanoma - ocular | 10 | 0.1 | 0.1-0.3 | 42 | 1.1 | 0.8-1.4 | 54 | 2.0 | 1.5-2.6 | 13 | 2.1 | 1.1-3.6 |
| Thoracic system | ||||||||||||
| Lung | 52 | 0.7 | 0.6-1.0 | 1,290 | 32.9 | 31.1-34.7 | 6,665 | 245.8 | 239.9-251.7 | 2,330 | 373.1 | 358.1-388.5 |
| Lung - adenocarcinoma | 32 | 0.5 | 0.3-0.6 | 579 | 14.7 | 13.6-16.0 | 2,524 | 93.1 | 89.5-96.8 | 789 | 126.3 | 117.7-135.5 |
| Lung - large cell | ** | ** | ** | 20† | 0.5 | 0.3-0.8 | 94 | 3.5 | 2.8-4.2 | 17 | 2.7 | 1.6-4.4 |
| Lung - small cell | ** | ** | ** | 155† | 3.9 | 3.4-4.6 | 704 | 26.0 | 24.1-27.9 | 148 | 23.7 | 20.0-27.8 |
| Lung - squamous cell | ** | ** | ** | 135† | 3.4 | 2.9-4.1 | 1,120 | 41.3 | 38.9-43.8 | 344 | 55.1 | 49.4-61.2 |
| Urinary system | ||||||||||||
| Bladder | 52 | 0.7 | 0.6-1.0 | 502 | 12.8 | 11.7-14.0 | 2,396 | 88.3 | 84.8-92.0 | 1,165 | 186.5 | 176.0-197.6 |
| Kidney | 106 | 1.5 | 1.2-1.8 | 760 | 19.4 | 18.0-20.8 | 1,410 | 52.0 | 49.3-54.8 | 333 | 53.3 | 47.7-59.4 |
Abbreviation: CI means confidence interval.
Symbols:
*Significant increasing trend in age-specific rate with increasing age.
**Suppressed due to small case count (less than 6).
†Count has been rounded to ensure confidentiality; associated rate and confidence interval have been adjusted to reflect rounded count.
Notes:
- Rates are per 100,000.
- Excludes cases with no age information.
- Only selected subsites and histological subtypes of major cancers are shown. As a result, counts for these may not add to the total for each cancer type.
Analysis by: Surveillance, Ontario Health (Cancer Care Ontario)
Data source: Ontario Cancer Registry (March 2021), Ontario Health (Cancer Care Ontario)
Ages 0 to 39
Five percent of all new cases occurred in people under age 40, with female breast and thyroid being the leading cancers.
The under-40 age group also accounted for the majority of new cases of Hodgkin lymphoma (53.3%) and testicular cancer (68.2%).
From 2016 to 2020, about 0.5% of all new cancers occurred in children ages 0 to 14. Childhood cancers are, in general, distinct from adult cancers, with differences in cancer types, biology, treatments and response to treatment. The most common types of childhood cancer are leukemias (32.9%), central nervous system tumours (23.6%) and lymphomas (12.7%) (see Spotlight: Childhood Cancer Incidence, Table 4.S1).
For more details on childhood cancer incidence, read the Pediatric Oncology Group of Ontario Surveillance Report.
Spotlight: Childhood Cancer Incidence
| Types of cancer/tumour (ICCC diagnosis group) | N | % | Age-specific incidence rate | ASIR | ASIR 95% CI |
|---|---|---|---|---|---|
| All cancers combined | 1,935 | 100.0% | 171.30 | 173.40 | 165.70 - 181.30 |
| I. Leukemias, myeloproliferative diseases, and myelodysplastic diseases | 636 | 32.9% | 56.30 | 57.29 | 52.92 - 61.93 |
| II. Lymphomas and reticuloendothelial neoplasms | 246 | 12.7% | 21.78 | 21.63 | 19.01 - 24.52 |
| III. CNS and miscellaneous intracranial and intraspinal neoplasms | 456 | 23.6% | 40.36 | 40.54 | 36.90 - 44.45 |
| IV. Neuroblastoma and other peripheral nervous system tumours | 136 | 7.0% | 12.04 | 12.62 | 10.59 - 14.93 |
| V. Retinoblastoma | 38 | 2.0% | 3.36 | 3.55 | 2.51 - 4.87 |
| VI. Renal tumours | 76 | 3.9% | 6.73 | 6.88 | 5.42 - 8.62 |
| VII. Hepatic tumours | 45 | 2.3% | 3.98 | 4.16 | 3.03 - 5.57 |
| VIII. Malignant bone tumours | 69 | 3.6% | 6.11 | 6.00 | 4.67 - 7.61 |
| IX. Soft tissue and other extraosseous sarcomas | 111 | 5.7% | 9.83 | 9.88 | 8.13 - 11.91 |
| X. Germ cell tumours, trophoblastic tumours, and neoplasms of gonads | 61 | 3.2% | 5.40 | 5.46 | 4.18 - 7.03 |
| XI. and XII. Other and unspecified malignant neoplasms | 61 | 3.2% | 5.40 | 5.36 | 4.10 - 6.90 |
Abbreviations: ASIR means age-standardized incidence rate; CI means confidence interval; CNS means central nervous system; ICCC means International Classification of Childhood Cancer
Notes:
- Rates are per 1,000,000.
- The POGONIS database classifies childhood cancer according to the International Classification of Childhood Cancer, third edition, which has 12 main diagnostic groups.
- Pediatric incidence is reported over 5-year period due to variations in annual incidence and potential for small cell disclosure.
Analysis by: Health Analytics, POGO
Data source: Pediatric Oncology Group of Ontario Networked Information System (POGONIS, April 7, 2021), POGO
Ages 40 to 59
Of all new cases, 22.7% occurred in people ages 40 to 59, with colorectal and female breast being the leading cancers.
Nearly half of all new cases of thyroid cancer occurred in people ages 40 to 59 and 41.0% of new cervical cancer cases occurred in females in this age group.
Ages 60 to 79
Of all new cases, 53.9% occurred in people ages 60 to 79.
This age group was more likely than other age groups to be diagnosed with the most common cancers:
- 47.8% of new cases of female breast cancer
- 50.8% of new cases of colorectal cancer
- 64.5% of new cases of lung cancer
- 71.5% of new cases of prostate cancer
Age 80 and older
Of all new cases, 18.3% occurred in people age 80 or older, with lung and colorectal being the leading cancers.
Cancer incidence increased with age, from a rate of 61.0 per 100,000 in people diagnosed at age 39 or younger to 2,486.2 per 100,000 in people diagnosed at age 80 or older. Rates varied by cancer type. Incidence rates for the following cancer types increased significantly with age:
- malignant and non-malignant cancers of the brain and other nervous system
- colon excluding rectum and right-sided colon
- leukemia, including acute and chronic myeloid leukemias
- lymphoma, including extranodal non-Hodgkin lymphoma
Gliomas (other than glioblastoma), testicular cancer and acute lymphocytic leukemia showed non-significant decreases with age, while all other cancer types increased non-significantly or remained stable with age.
Incidence Trends by Cancer Type
This section describes annual percent changes in the age-standardized incidence rates, which are used to examine short-term changes in the trend in rates over time (Table 4.5).
Following a long period of stable rates, the age-standardized incidence rate for all cancers combined decreased by 1.4% per year from 2007 to 2014 before stabilizing again in recent years.
Among males, the incidence rate remained stable from 1984 to 2007, decreased by 2.8% per year until 2014 and was stable from 2014 to 2018. Although the cancer incidence rate among females did not see a similar decrease, the incidence rate stabilized from 2002 to 2018 following a steady increase of 0.5% per year from 1984 to 2002.
| Cancer type | Males and females combined Period |
Males and females combined APC (%) |
Males Period |
Males APC (%) |
Females Period |
Females APC (%) |
|---|---|---|---|---|---|---|
| All cancers | 1984–1991 1991–2007 2007–2014 2014–2018 |
0.8 0.3 -1.4* 0.1 |
1984–1992 1992–2007 2007–2014 2014–2018 |
0.8 -0.1 -2.8* 0.2 |
1984–2002 2002–2018 |
0.5* 0 |
| Brain and other nervous system – malignant | 1984–2008 2008–2018 |
-0.3* -1.5* |
1984–2018 | -0.5* | 1984–2018 | -0.8* |
| Glioblastoma | 1984–2001 2001–2005 2005–2009 2009–2018 |
1.7* -6.2 6.6 0.2 |
1984–2018 | 0.7* | 1984–2001 2001–2005 2005–2012 2012–2018 |
1.6* -7.7 5.6* -0.8 |
| All other gliomas | 1984–2004 2004–2008 2008–2018 |
-1.8* 4.7 -3.1* |
1984–2018 | -1.1* | 1984–2018 | -1.1* |
| Brain and other nervous system – non-malignant | - | ** | - | ** | - | ** |
| Meningiomas | - | ** | - | ** | - | ** |
| Pituitary, pineal and craniopharyngeal duct | - | ** | - | ** | - | ** |
| Breast (female) | n/a n/a n/a n/a |
n/a n/a n/a n/a |
n/a n/a n/a n/a |
n/a n/a n/a n/a |
1984–1991 1991–1999 1999–2012 2012–2018 |
1.9* 0.5 -0.7* 0.4 |
| Cervix | n/a n/a n/a n/a |
n/a n/a n/a n/a |
n/a n/a n/a n/a |
n/a n/a n/a n/a |
1984–2006 2006–2010 2010–2014 2014–2018 |
-2.1* 2.2 -5 3.7 |
| Ovary | n/a n/a |
n/a n/a |
n/a n/a |
n/a n/a |
1984–2001 2001–2018 |
0.4* -1.1* |
| Prostate | n/a n/a n/a n/a |
n/a n/a n/a n/a |
1984–1992 1992–2007 2007–2014 2014–2018 |
6.2* 1.3* -6.6* 1.9 |
n/a n/a n/a n/a |
n/a n/a n/a n/a |
| Testis | n/a | n/a | 1984–2018 | 1.3* | n/a | n/a |
| Uterus | n/a n/a n/a n/a |
n/a n/a n/a n/a |
n/a n/a n/a n/a |
n/a n/a n/a n/a |
1984–1989 1989–2005 2005–2011 2011–2018 |
-2.4 0.5* 3.9* 1.2* |
| Uterus – endometrial | n/a n/a n/a n/a |
n/a n/a n/a n/a |
n/a n/a n/a n/a |
n/a n/a n/a n/a |
1984–1989 1989–2005 2005–2011 2011–2018 |
-3.4* 0.6* 4.8* 1.2* |
| Uterus – uterine sarcoma | n/a | n/a | n/a | n/a | 1984–2018 | 1.1* |
| Colorectal | 1984–1996 1996–2000 2000–2008 2008–2018 |
-1.0* 1.2 -0.9* -2.4* |
1984–2008 2008–2018 |
-0.4* -2.6* |
1984–1996 1996–2000 2000–2010 2010–2018 |
-1.4* 1.4 -1.3* -2.4* |
| Colon excluding rectum | 1984–1996 1996–2008 2008–2018 |
-1.0* -0.3 -2.5* |
1984–2009 2009–2018 |
-0.6* -2.7* |
1984–1992 1992–2008 2008–2018 |
-1.6* -0.6* -2.4* |
| Colon – left sided | 1984–2004 2004–2008 2008–2018 |
-1.1* 1.4 -3.9* |
1984–2004 2004–2008 2008–2018 |
-0.8* 2.0 -4.2* |
1984–2009 2009–2018 |
-1.3* -3.1* |
| Colon – right sided | 1984–2011 2011–2018 |
0.0 -2.5* |
1984–2011 2011–2018 |
0.1 -2.3* |
1984–2011 2011–2018 |
-0.1 -2.8* |
| Rectum and rectosigmoid junction | 1984–1996 1996–2001 2001–2018 |
-1.0* 3.1* -1.8* |
1984–1997 1997–2001 2001–2018 |
-0.6 3.7 -2.0 |
1984–1996 1996–2000 2000–2018 |
-1.6* 4.2 -1.6* |
| Rectosigmoid junction | 1984–2001 2001–2018 |
2.4* -3.8* |
1984–2001 2001–2018 |
2.4* -3.8* |
1984–1991 1991–1996 1996–2000 2000–2018 |
4.5* -5.2 11.8 -4.2* |
| Rectum | 1984–1991 1991–2008 2008–2018 |
-3.0* 0.3* -1.5* |
1984–1995 1995–2006 2006–2018 |
-1.6* 0.9* -1.8* |
1984–1991 1991–2018 |
-3.7* -0.1 |
| Esophagus | 1984–2006 2006–2010 2010–2014 2014–2018 |
-0.1 3.7 -4.7* 2.0 |
1984–2006 2006–2010 2010–2014 2014–2018 |
0.1 4.5 -5.2* 1.9 |
1984–2018 | -0.7* |
| Esophagus – adenocarcinoma | 1984–2010 2010–2018 |
3.5* -0.8 |
1984–2010 2010–2018 |
3.4* -0.9 |
1984–2018 | 2.6* |
| Esophagus – squamous cell carcinoma | 1984–2018 | -2.1* | 1984–2018 | -2.4* | 1984–2018 | -1.9* |
| Liver | 1984–2008 2008–2012 2012–2018 |
4.0* 9.5* -1.5 |
1984–2013 2013–2018 |
4.6* -0.9 |
1984–2008 2008–2012 2012–2018 |
3.3* 14.8* -2.6 |
| Pancreas | 1984–2006 2006–2013 2013–2018 |
-0.7* 3.0* -1.1 |
1984–2003 2003–2018 |
-1.3* 1.7* |
1984–2006 2006–2012 2012–2018 |
-0.4* 2.8* -1.1 |
| Stomach | 1984–2007 2007–2018 |
-1.8* 0.4 |
1984–2008 2008–2018 |
-1.9* 0.4 |
1984–1999 1999–2018 |
-2.5* -0.1 |
| Larynx | 1984–2018 | -2.4* | 1984–2018 | -2.4* | 1984–2018 | -2.7* |
| Oral cavity and pharynx | 1984–2003 2003–2018 |
-1.9* 1.4* |
1984–2003 2003–2018 |
-2.4* 1.5* |
1984–2003 2003–2018 |
-1.3* 0.9* |
| Hypopharynx | 1984–2018 | -2.6* | 1984–2018 | -2.4* | 1984–2018 | -3.5* |
| Lip and oral cavity | 1984–2003 2003–2018 |
-2.9* 1.3* |
1984–2003 2003–2018 |
-3.8* 0.9 |
1984–2003 2003–2018 |
-1.4* 1.7* |
| Nasopharynx | 1984–2018 | 0.0 | 1984–2018 | 0.2 | 1984–2018 | -0.3 |
| Oropharynx | 1984–1998 1998–2018 |
-1.1 2.5* |
1984–1998 1998–2018 |
-1.2 3.1* |
1984–2018 | 0.0 |
| Thyroid | 1984–1998 1998–2002 2002–2013 2013–2018 |
4.8* 13.3* 6.3* -4.1* |
1984–2014 2014–2018 |
6.6* -2.2 |
1984–1998 1998–2002 2002–2013 2013–2018 |
4.9* 15.1* 5.9* -5.0* |
| Thyroid – anaplastic | 1984–2018 | -0.1 | 1984–2018 | 2.0* | 1984–2018 | -1.1 |
| Thyroid – follicular | 1984–2018 | -0.7* | 1984–2018 | -0.8 | 1984–2018 | -0.7* |
| Thyroid – medullary | 1984–2018 | 2.0* | 1984–2018 | 2.1* | 1984–2018 | 1.9* |
| Thyroid – papillary | 1984–2012 2012–2018 |
9.1* -3.3* |
1984–2013 2013–2018 |
8.5* -1.0 |
1984–1998 1998–2002 2002–2012 2012–2018 |
7.7* 14.5* 8.2* -3.9* |
| Leukemia | 1984–2000 2000–2007 2007–2018 |
-0.3 1.7 -1.1* |
1984–2010 2010–2018 |
0.3 -1.3* |
1984–2001 2001–2009 2009–2018 |
-0.4 1.8 -1.8* |
| Acute lymphocytic leukemia | 1984–2018 | 0.9* | 1984–2018 | 0.9* | 1984–2018 | 0.8* |
| Acute monocytic leukemia | 1984–2018 | 2.6* | 1984–2018 | 2.5* | 1984–2018 | 2.4* |
| Acute myeloid leukemia | 1984–2018 | 0.7* | 1984–2018 | 0.7* | 1984–2018 | 0.6* |
| Chronic lymphocytic leukemia | 1984–2008 2008–2018 |
1.2* -2.6* |
1984–2009 2009–2018 |
1.1* -3.1* |
1984–2000 2000–2004 2004–2018 |
-0.2 7.4 -2.5* |
| Chronic myeloid leukemia | 1984–2004 2004–2018 |
-1.0* 1.6* |
1984–2004 2004–2018 |
-1.2* 1.6* |
1984–2018 | 0.2 |
| Lymphoma | 1984–1998 1998–2009 2009–2013 2013–2018 |
1.6* 0.6* 4.2* -0.4 |
1984–2009 2009–2013 2013–2018 |
1.1* 4.4* -0.7 |
1984–1998 1998–2008 2008–2012 2012–2018 |
1.8* 0.2 3.2 0.4 |
| Hodgkin lymphoma | 1984–2018 | -0.3* | 1984–2018 | -0.5* | 1984–2018 | 0.0 |
| Non-Hodgkin lymphoma | 1984–1998 1998–2009 2009–2013 2013–2018 |
1.9* 0.7* 4.6* -0.5 |
1984–1990 1990–2009 2009–2013 2013–2018 |
3.1* 1.2* 5.0* -0.8 |
1984–1998 1998–2008 2008–2012 2012–2018 |
2.1* 0.3 3.7 0.2 |
| Non-Hodgkin lymphoma – extranodal | 1984–2007 2007–2011 2011–2018 |
7.4* 44.5* 2.7 |
1984–2007 2007–2012 2012–2018 |
7.6* 37.7* -0.1 |
1984–2007 2007–2011 2011–2018 |
7.9* 41.6* 3.1 |
| Non-Hodgkin lymphoma – nodal | 1984–2007 2007–2013 2013–2018 |
0.9* -7.3* -0.2 |
1984–2007 2007–2011 2011–2018 |
1.1* -8.7 -1.5 |
1984–1994 1994–2007 2007–2013 2013–2018 |
2.2* 0.2 -7.0* -0.9 |
| Myeloma | 1984–2008 2008–2018 |
0.3 2.6* |
1984–2003 2003–2007 2007–2011 2011–2018 |
0.7* -3.6 6.4 1.5 |
1984–2009 2009–2018 |
0.1 2.6* |
| Melanoma of the skin | 1984–1988 1988–1992 1992–2014 2014–2018 |
4.9 -2.6 2.3* -0.4 |
1984–1988 1988–1992 1992–2014 2014–2018 |
7 -2 2.4* -1 |
1984–1993 1993–2018 |
-0.4 2* |
| Melanoma (non-cutaneous) | 1984–2018 | 0.7* | 1984–2018 | 0.7* | 1984–2018 | 0.8* |
| Melanoma – mucosal | 1984–2006 2006–2010 2010–2018 |
-0.4 41.0 -1.6 |
- | ** ** ** |
- | ** ** ** |
| Melanoma – ocular | 1984–2018 | -0.1 | 1984–2018 | 0.1 | 1984–2018 | -0.3 |
| Lung | 1984–1991 1991–2008 2008–2012 2012–2018 |
0.5 -0.9* 0.7 -1.9* |
1984–1990 1990–2008 2008–2012 2012–2018 |
-0.7 -2.1* 0.4 -2.9* |
1984–1998 1998–2008 2008–2012 2012–2018 |
2.1* 0.2 1.6 -1.0* |
| Lung – adenocarcinoma | 1984–1996 1996–2008 2008–2012 2012–2018 |
2.5* -0.9* 10.0* -1.5* |
1984–1998 1998–2007 2007–2012 2012–2018 |
1.1* -2.9* 7.8* -1.7* |
1984–1995 1995–2008 2008–2014 2014–2018 |
4.1* 0.5 7.5* -4.4* |
| Lung – large cell | 1984–2000 2000–2004 2004–2018 |
0.1 -15.1* -7.2* |
1984–2000 2000–2004 2004–2018 |
-1.0* -17.4* -6.8* |
1984–1999 1999–2018 |
2.3* -8.5* |
| Lung – small cell | 1984–1990 1990–2011 2011–2018 |
4.1* -0.6* -2.3* |
1984–1991 1991–2018 |
2.2 -1.7* |
1984–1997 1997–2018 |
3.3* -0.5* |
| Lung – squamous cell | 1984–1989 1989–2008 2008–2012 2012–2018 |
-0.5 -3.5* 4.4 -2.4* |
1984–1988 1988–2008 2008–2012 2012–2018 |
-0.5 -4.4* 3.6 -2.8* |
1984–1996 1996–2007 2007–2012 2012–2018 |
0.7 -2.7* 5.0* -1.7 |
| Bladder† | 1989–2018 | -1.2* | 1989–2018 | -1.3* | 1989–2018 | -1.3* |
| Kidney | 1984–1990 1990–1996 1996–2018 |
3.6* -0.8 1.7* |
1984–1989 1989–1999 1999–2018 |
4.9* -0.4 2.0* |
1984–2018 | 1.1* |
Abbreviations: APC means annual percent change; n/a means not applicable.
Symbols:
*Statistically significant trend.
**Too few cases to calculate.
†Bladder cancer trend begins at 1989 due to classification changes.
Notes:
- Rates are standardized to the age distribution of the 2011 Canadian Standard population.
- Only selected subsites and histological subtypes of major cancers are shown.
- For all cancers combined, breast cancer, melanoma of the skin and bladder cancer, the National Cancer Institute Surveillance, Epidemiology and End Results Program standards for counting multiple primary cancers were used for assessing trends over time. For all other cancer types, the International Agency for Research on Cancer/International Association of Cancer Registries multiple primary rules were used.
- The jump model in the Joinpoint software was applied in trend analyses for all cancers combined, breast cancer, melanoma of the skin and bladder cancer.
Analysis by: Surveillance, Ontario Health (Cancer Care Ontario)
Data source: Ontario Cancer Registry (March 2021), Ontario Health (Cancer Care Ontario)
Recent incidence trends for the 4 most common cancers
BREAST CANCER
The age-standardized incidence rate for female breast cancer in Ontario increased by 1.9% per year until 1991. It then stabilized from 1991 to 1999 before steadily decreasing at 0.7% per year until 2012. The rate has remained stable in recent years. This trend is likely due to the diminishing number of women with undetected cancer. This kind of rise and fall in incidence rate is typical when a new method of early diagnosis is introduced.
The decrease in breast cancer incidence rate may also have been due to the reduced use of hormone replacement therapy starting in the early 2000s. Hormone replacement therapy is associated with an increased risk of breast cancer among post-menopausal women.[25,26]
COLORECTAL CANCER
The age-standardized incidence rate for colorectal cancer among males decreased by 2.6% per year from 2008 to 2018. Incidence rates for colon cancer and rectal cancer dropped in males during this period.
Among females, the colorectal cancer incidence rate was stable from 1996 to 2000. It then decreased after 2000, first at a rate of 1.3% per year until 2010, and then more rapidly by 2.4% per year until 2018. These patterns may reflect the following opposing trends for colorectal cancer subsites in females:
- an increase in cancer of the rectosigmoid junction from 1996 to 2000
- an overall decrease in colon cancer from 1984 to 2018
LUNG CANCER
In males, the age-standardized incidence rate for lung cancer experienced 2 periods of significant decrease – the first from 1990 to 2008 at a rate of 2.1% per year and then again more recently from 2012 to 2018 at a rate of 2.9% per year. The incidence rate among females increased from 1984 to 1998, remained stable until 2012 and then began steadily decreasing by 1.0% per year.
The differences in timing for these decreases in lung cancer incidence rates in males and females over the last 2 decades reflect historical differences in male and female smoking rates.[27] While tobacco use is the primary cause of lung cancer, other causes include exposure to radon, asbestos, second-hand smoke and air pollution.
PROSTATE CANCER
The age-standardized incidence rate for prostate cancer increased 1.3% per year from 1992 to 2007, and then fell by 6.6% per year from 2007 to 2014 before stabilizing in recent years. An abrupt rise and fall in incidence rate is common when a new method of early diagnosis is introduced or its frequency of use is heavily influenced by clinical guidance. For example, the widespread use of the prostate-specific antigen test has led to the early detection of prostate cancer. However, a decrease in the use of the test reflects the influence of recommendations from the U.S. Preventive Services Task Force against using prostate-specific antigen testing to routinely screen healthy males[28].
Notable changes in trend for other cancers
CERVICAL CANCER
Following 2 decades of decline, the cervical cancer incidence rate had no significant upward or downward trend from 2006 to 2018. However, from 2010 to 2014 there was a decrease in the incidence rate for cervical cancer of 5.0% per year (although not statistically significant), which follows the introduction of school-based human papillomavirus vaccination for Ontario girls in 2007. A drop in cervical cancer incidence has also been observed in other jurisdictions where human papillomavirus vaccination was introduced.[29]
LEUKEMIA
Following 3 decades of stable trends, leukemia incidence rates began decreasing in 2007. Since 2008, the incidence rate for chronic lymphocytic leukemia in particular has decreased, while the rates for other leukemia types have increased. The decreasing trend in chronic lymphocytic leukemia mirrors recent observations in other countries [30], and likely reflects the effect of the change of the more restricted diagnostic criteria for chronic lymphocytic leukemia in 2008.[31, 32]
LIVER CANCER
Incidence rates for liver cancer increased steeply from 1984 to 2012, although the rates have stabilized in recent years. Among males, the age-standardized incidence rate increased at a rate of 4.6% per year from 1984 to 2013 and was stable from 2013 to 2018. The trend was more pronounced among females, with the age-standardized incidence rate increasing by 3.3% per year from 1984 to 2008, by 14.8% per year from 2008 to 2012, and finally stabilizing from 2012 to 2018.
The abrupt stabilization of the upward incidence trend in liver cancer could be due to the recent introduction of direct-acting antiviral treatment for viral hepatitis C, and suggests that the risk of liver cancer among people treated for hepatitis may be lower in the medium- to long-term.[33]
LYMPHOMA
A steady increase in lymphomas from 1984 to 2013 plateaued from 2013 to 2018, mirroring the trend in non-Hodgkin lymphoma. Following a prominent increase from 2009 to 2013 of 4.6% per year, the non-Hodgkin lymphoma rate stabilized from 2013 to 2018.
MYELOMA
For males and females combined, the age-standardized incidence rate for myeloma increased by 2.6% per year from 2008 to 2018. This trend is likely driven by a similar increase among females.
THYROID CANCER
The age-standardized incidence rate for thyroid cancer decreased significantly, following nearly 3 decades of increasing rates. The incidence rate decreased by 4.1% per year from 2013 to 2018, largely due to the declining trend in papillary thyroid cancer. This trend was most prominent in females who experienced a decrease in rate of 5.0% per year over the same period.
UTERINE CANCER
The age-standardized incidence rate for uterine cancer increased by 3.9% per year from 2005 to 2011 and continued to increase at a slower rate of 1.2% per year from 2011 to 2018. These increases were mainly due to rising incidence rates for the endometrial subsite (4.8% per year from 2005 to 2011).
Increasing incidence of endometrial cancer in other jurisdictions suggests a link to rising rates of obesity and decreasing rates of pregnancy, both of which increase exposure to estrogen, a key risk factor for endometrial cancer.[34]
Thirty-five year trend in incidence
The age-standardized incidence rates from 1984 to 2018 for selected cancers are shown in Figure 4.3. These cancers represent the 4 most common cancers in Ontario (breast, prostate, lung and colorectal) and cancers with significantly increasing recent age-standardized incidence rate trends.
Over the last 35 years (1984 to 2018) the average annual percent change in age-standardized incidence rate for males (Figure 4.4):
- increased most for thyroid cancer (5.5%), liver cancer (3.7%), melanoma (2.3%) and kidney cancer (1.7%)
- remained stable for esophageal, pancreatic and prostate cancers, leukemia, myeloma and all cancers combined
- decreased most for laryngeal (2.4%), lung (1.7%), bladder (1.6%) and stomach (1.2%) cancers
For females, the average annual percent change:
- increased most for thyroid (4.8%) and liver (3.5%) cancers, as well as for Non-Hodgkin lymphoma (1.4%) and melanoma (1.3%)
- remained stable for pancreatic cancer, Hodgkin lymphoma and leukemia
- decreased most for laryngeal (2.7%), cervical (1.3%), bladder (2.0%) and stomach (1.2%) cance
Incidence Trends by Age
Over the past 35 years, cancer incidence rates have been generally increasing among people under 40 and decreasing among people 80 and older, although these trends differ by sex.
Ages 0 to 39
Among people under age 40, the cancer incidence rate increased by 0.5% per year from 1981 to 2001, and then by 1.6% per year from 2001 to 2011 before stabilizing from 2011 to 2018 (Figure 4.5).
Different trends were seen in males and females. Among males, the rate increased by 1.9% per year from 1984 to 1990, remained stable until 2001 and then increased by 0.8% per year from 2001 to 2018. For females, the rate was stable from 1984 to 1994, increased by 1.7% per year until 2009 and then stabilized from 2009 to 2018. The increase in incidence among males is probably due to the increasing rates of testicular, colorectal and thyroid cancers in this age group (data not shown).
Among children ages 0 to 14, the overall average annual percent change in age-standardized incidence rate was stable from 1986 to 2020 (0.3% per year, not significant), but increased by 1.7% per year from 2002 to 2015 before becoming relatively stable again from 2015 to 2020 (see Spotlight: Childhood Cancer Incidence Trend, Figure 4.S1).
For more details on childhood cancer incidence trends, read the Pediatric Oncology Group of Ontario Surveillance Report.
Spotlight: Childhood Cancer Incidence Trend
Ages 40 to 59
Among people ages 40 to 59, the rate of cancer increased by 0.5% per year from 1984 to 2007 and then decreased by 0.5% per year from 2007 to 2018. While the trend among males was similar to the overall trend, the female rate increased by 0.4% per year from 1984 to 2018.
Ages 60 to 79
For people ages 60 to 79, the rate increased by 1.2% per year from 1984 to 1992, remained stable until 2007, decreased by 2.2% per year from 2007 to 2014 and was stable from 2014 to 2018. The trend among males was similar to the overall trend, although the rate of decrease from 2007 to 2014 was greater, at 3.7% per year. Females in this age group had no significant increase or decrease in incidence rate, remaining stable from 1984 to 2018.
Ages 80 and older
In the oldest age group (people age 80 and older), the incidence rate decreased steadily from 1984 to 2018 by 0.2% per year. While males had a period of stable incidence rates from 1984 to 1991, followed by a decrease of 1.2% per year from 1991 onward, the female rate increased slowly by 0.2% per year from 1984 to 2018.
Incidence by Stage
“Cancer staging” refers to classifying people with cancer into groups according to the extent of their disease. “Stage at diagnosis” is the extent of the disease at the time of initial diagnosis.
A stage group (i.e., stage 0, 1, 2, 3 or 4) is based on distinct characteristics of a tumour that describe the extent of spread of a cancer in the body. Knowing the stage of the disease helps physicians plan appropriate treatment and determine the likely outcome or course of the disease. Information about stage at diagnosis is one of the most important factors for predicting the outcome for someone with cancer.
A cancer diagnosed at an early stage is more likely to be treated successfully. If the cancer has spread, treatment becomes more difficult and someone’s chances of survival are generally much lower.
The stage group is useful as a comparator within and across different cancer types, as well as for comparing trends over time. High-quality stage information at the population level supports healthcare providers, administrators, researchers and decision-makers in planning, evaluating and enhancing quality of care to improve treatment outcomes.
Population-level stage at diagnosis data with high completeness are available in Ontario for 5 cancers: female breast, prostate, colorectal, lung and cervical. In 2018, a new staging classification scheme was adopted by the Ontario Cancer Registry that affects the stage distribution of many cancers for cases diagnosed from 2018 onward (see Appendix 1: Data Sources).
The majority of breast, prostate and cervical cancer cases, and half of all staged colorectal cancer cases were diagnosed at stage 1 or 2.
The majority of breast, prostate and cervical cancer cases, and half of all staged colorectal cancer cases were diagnosed at stage 1 or 2 (Figure 4.6). Some of these early stage diagnoses may partly be because screening is available for breast, colorectal and cervical cancers. The breast and colorectal screening programs aim to detect cancers at an early stage, while the cervical screening program’s goal is to prevent cancer by detecting and treating pre-cancers. The distribution of stage varied by cancer type:
- The majority of staged breast cancer cases were diagnosed at stage 1 (72.6%) or stage 2 (14.7%) in 2018.
- Cervical cancer was most likely to be diagnosed at stage 1 (61.0%). People diagnosed at a later stage are less likely to have been routinely screened, which supports the need for efforts to improve cervical screening participation in the population.(35) About 8.3% of cases were not diagnosed until stage 4.
- The majority of staged colorectal cancer cases were diagnosed at stage 2 (27.1%) or stage 3 (29.7%). The distribution of stage was similar for the colorectal cancer subsites; however, a slightly greater proportion of cancers of the rectum (33.6%) and rectosigmoid junction (30.5%) were diagnosed at stage 3.
- Prostate cancer was most likely to be diagnosed at stage 2 (41.2%), followed by stage 3 (23.1%).
- Lung cancer was most likely to be diagnosed at stage 4, which accounted for 46.7% of all staged lung cancer cases. Out of all lung cancer subtypes, small cell lung cancer had the greatest proportion of cases diagnosed at stage 4 (68.3%).
Trends in stage distribution
The distribution of stage at diagnosis for female breast, prostate, colorectal, lung and cervical cancers changed from 2010 to 2017 (Figure 4.7). Because of the change in staging rules starting in 2018, cases from this year are excluded from the comparison with historical stage group distributions.
- The proportion of prostate cancer cases diagnosed at stage 1 decreased from 27% in 2010 to 24% in 2017. However, the proportion of cases diagnosed at stage 4 increased from 8% in 2010 to 12% in 2017. This shift in stage distribution may be partly because less opportunistic screening for prostate cancer took place following a recommendation against using the prostate-specific antigen test.(28,36) This recommendation may have resulted in the detection of fewer early stage cases and more symptomatic cases at later stages.
- The proportion of lung cancer cases diagnosed at stage 1 increased from 18% in 2010 to 24% in 2017, while the proportion of cases diagnosed at stage 4 decreased from 57% in 2010 to 47% in 2017. Some evidence suggests that this downward shift in stage at diagnosis may reflect earlier detection resulting from recent lung cancer awareness campaigns.(37)
- The stage distribution has remained relatively unchanged for colorectal cancer. There was no change in the proportion of cases diagnosed at early stages from 2010 to 2017. The proportion of cases diagnosed at later stages shifted slightly from 20% diagnosed at stage 4 in 2010 to 19% in 2017, and from 30% diagnosed at stage 3 in 2010 to 31% in 2017.
- The proportion of cervical cancer cases diagnosed at stage 1 dropped from 62% in 2010 to 56% in 2017, while the proportion of cases diagnosed at stage 2 increased from 9% in 2010 to 18% in 2017. This shift in stage distribution may be explained by factors such as decreasing screening participation (38) and inadequate follow-up of abnormal screening results in some people (38). Lack of timely and appropriate access to care for people with symptoms may also have contributed to this change. To better understand this shift in stage distribution in Ontario, further analysis is warranted.
- The stage distribution of breast cancer cases remained relatively stable, with the proportion of early-stage cases increasing slightly (from 43% to 44% for stage 1 and 37% to 39% for stage 2) from 2010 to 2017.