
Ontario Cancer Statistics 2022 Ch 7: Cancer Prevalence
Cancer prevalence measures the number of people diagnosed with cancer who are still alive. This chapter presents prevalence counts and proportions for people diagnosed with cancer within a specific timeframe who were still alive on January 1, 2019.
What's on this page
There are more people living with a diagnosis of cancer in Ontario than there were 20 years ago. Cancer prevalence – the number of people previously diagnosed with cancer who are alive at a given point in time – is a function of the incidence of and survival for cancer. With increasing incidence and improving survival, the prevalence of cancer over time has also been increasing in Ontario, a province with an estimated population of 14.7 million in 2020.
Because trends in cancer prevalence reflect the increase, decrease or stability of cancer incidence and mortality rates in the population, they can help determine how best to distribute diagnostic, treatment and care resources.(1)
This chapter presents limited-duration, person-based prevalence counts. “Limited-duration” cancer prevalence describes the number of people alive on a certain date (called the index date) who were diagnosed with cancer within a specified previous number of years (e.g., 2 years, 5 years, 10 years, 30 years). This information is directly measured from the registry's observations and does not include prevalent cases diagnosed before the start of the limited-duration period. This report uses an index date (i.e., a reference date) of January 1, 2019, and focuses on long-term prevalence (10 and 30 years). “Person-based” prevalence counts are when a person with cancer is counted only once even if they have had more than 1 cancer diagnosis.
Prevalence counts based on duration are important for understanding the impacts of cancer on the healthcare system. In the first 2 years after their cancer diagnosis, the main healthcare services someone would use are related to primary treatment. During the next 3 years, healthcare services would mainly consist of clinical assessment to see if the cancer has returned. In the next 5 years, follow-up services would mainly be accessed.
People living with cancer (prevalent cases) whose cancer diagnosis occurred in the previous 10 or more years are considered long-term survivors. Their cancer experiences are often important for understanding the long-term (or late) effects of a cancer diagnosis and the associated use of healthcare services. A 30-year period provides a reasonable time window for accounting for all adult cancer survivors and most childhood cancer survivors.
Prevalence by Sex and Cancer Type
At the end of 2018 (on the index date of January 1, 2019), an estimated 411,158 people (29 per 100,000 people) living in Ontario had been diagnosed with cancer in the previous 10 years (since 2009) (Table 7.1).
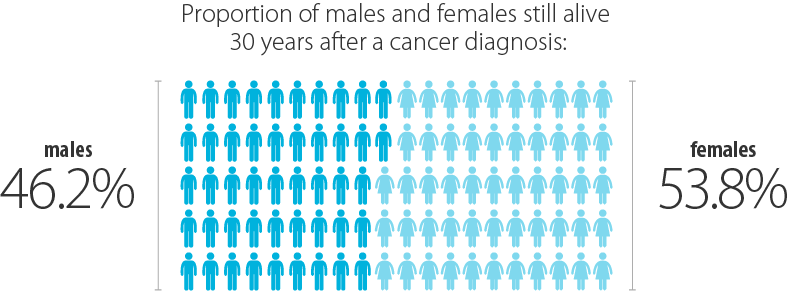
Looking back at those diagnosed in the previous 30 years (since 1989), 676,509 people in Ontario were still alive at the end of 2018, which is a prevalence proportion of 4,689.3 per 100,000. Of these people, 52.5% who were diagnosed in the previous 10 years and 53.8% who were diagnosed in the previous 30 years were female, even though the overall cancer incidence rates were higher among males (see Chapter 1: Estimated Current Cancer Incidence and Chapter 4: Cancer Incidence). This discrepancy largely reflects the higher prevalence of thyroid and lung cancers in female survivors because they have a higher incidence of thyroid cancer and higher survival for lung cancer than males. Breast cancer also contributes to this discrepancy due to the high incidence and survival for breast cancer among females.
| Cancer type | Males and females combined | Males | Females | |||||||||
|---|---|---|---|---|---|---|---|---|---|---|---|---|
| 10-year prevalence count | 10-year prevalence proportion | 30-year prevalence count | 30-year prevalence proportion | 10-year prevalence count | 10-year prevalence proportion | 30-year prevalence count | 30-year prevalence proportion | 10-year prevalence count | 10-year prevalence proportion | 30-year prevalence count | 30-year prevalence proportion | |
| All cancers | 411,158 | 2,850.0 | 676,509 | 4,689.3 | 195,257 | 2,741.0 | 312,800 | 4,391.1 | 215,901 | 2,956.3 | 363,709 | 4,980.2 |
| Brain and nervous system | ||||||||||||
| Brain and other nervous system - malignant | 3,513 | 24.4 | 7,024 | 48.7 | 1,939 | 27.2 | 3,724 | 52.3 | 1,574 | 21.6 | 3,300 | 45.2 |
| Glioblastoma | 846 | 5.9 | 1,025 | 7.1 | 493 | 6.9 | 589 | 8.3 | 353 | 4.8 | 436 | 6.0 |
| All other gliomas | 1,720 | 11.9 | 3,383 | 23.5 | 938 | 13.2 | 1,788 | 25.1 | 782 | 10.7 | 1,595 | 21.8 |
| Brain and other nervous system - non-malignant† | 15,910 | 110.3 | 15,916 | 110.3 | 6,443 | 90.5 | 6,446 | 90.5 | 9,467 | 129.6 | 9,470 | 129.7 |
| Meningiomas† | 5,113 | 35.4 | 5,115 | 35.5 | 1,468 | 20.6 | 1,468 | 20.6 | 3,645 | 49.9 | 3,647 | 49.9 |
| Pituitary, pineal and craniopharyngeal duct† | 4,119 | 28.6 | 4,120 | 28.6 | 1,996 | 28.0 | 1,997 | 28.0 | 2,123 | 29.1 | 2,123 | 29.1 |
| Breast and genital system | ||||||||||||
| Breast (female) | n/a | n/a | n/a | n/a | n/a | n/a | n/a | n/a | 78,182 | 1,070.5 | 141,829 | 1,942.0 |
| Cervix | n/a | n/a | n/a | n/a | n/a | n/a | n/a | n/a | 4,285 | 58.7 | 10,306 | 141.1 |
| Ovary | n/a | n/a | n/a | n/a | n/a | n/a | n/a | n/a | 5,810 | 79.6 | 10,277 | 140.7 |
| Prostate | n/a | n/a | n/a | n/a | 72,124 | 1,012.5 | 125,804 | 1,766.0 | n/a | n/a | n/a | n/a |
| Testis | n/a | n/a | n/a | n/a | 3,835 | 53.8 | 9,087 | 127.6 | n/a | n/a | n/a | n/a |
| Uterine | n/a | n/a | n/a | n/a | n/a | n/a | n/a | n/a | 19,749 | 270.4 | 32,438 | 444.2 |
| Uterus - endometrial | n/a | n/a | n/a | n/a | n/a | n/a | n/a | n/a | 18,757 | 256.8 | 30,104 | 412.2 |
| Uterus - uterine sarcoma | n/a | n/a | n/a | n/a | n/a | n/a | n/a | n/a | 392 | 5.4 | 790 | 10.8 |
| Digestive system | ||||||||||||
| Colorectal | 45,542 | 315.7 | 74,831 | 518.7 | 24,836 | 348.7 | 39,951 | 560.8 | 20,706 | 283.5 | 34,880 | 477.6 |
| Colon excluding rectum | 30,158 | 209.0 | 49,572 | 343.6 | 15,586 | 218.8 | 25,033 | 351.4 | 14,572 | 199.5 | 24,539 | 336.0 |
| Colon - left sided | 12,366 | 85.7 | 21,417 | 148.5 | 7,082 | 99.4 | 11,788 | 165.5 | 5,284 | 72.4 | 9,629 | 131.9 |
| Colon - right sided | 17,199 | 119.2 | 26,490 | 183.6 | 8,178 | 114.8 | 12,351 | 173.4 | 9,021 | 123.5 | 14,139 | 193.6 |
| Rectum and rectosigmoid junction | 16,306 | 113.0 | 26,547 | 184.0 | 9,826 | 137.9 | 15,689 | 220.2 | 6,480 | 88.7 | 10,858 | 148.7 |
| Rectosigmoid junction | 4,077 | 28.3 | 7,290 | 50.5 | 2,441 | 34.3 | 4,167 | 58.5 | 1,636 | 22.4 | 3,123 | 42.8 |
| Rectum | 12,229 | 84.8 | 19,257 | 133.5 | 7,385 | 103.7 | 11,522 | 161.8 | 4,844 | 66.3 | 7,735 | 105.9 |
| Esophagus | 1,828 | 12.7 | 2,354 | 16.3 | 1,390 | 19.5 | 1,740 | 24.4 | 438 | 6.0 | 614 | 8.4 |
| Esophagus - adenocarcinoma | 1,152 | 8.0 | 1,397 | 9.7 | 992 | 13.9 | 1,198 | 16.8 | 160 | 2.2 | 199 | 2.7 |
| Esophagus - squamous cell carcinoma | 544 | 3.8 | 746 | 5.2 | 308 | 4.3 | 404 | 5.7 | 236 | 3.2 | 342 | 4.7 |
| Liver | 2,992 | 20.7 | 3,955 | 27.4 | 2,186 | 30.7 | 2,884 | 40.5 | 806 | 11.0 | 1,071 | 14.7 |
| Pancreas | 2,963 | 20.5 | 3,787 | 26.3 | 1,524 | 21.4 | 1,901 | 26.7 | 1,439 | 19.7 | 1,886 | 25.8 |
| Stomach | 4,864 | 33.7 | 7,120 | 49.4 | 2,997 | 42.1 | 4,303 | 60.4 | 1,867 | 25.6 | 2,817 | 38.6 |
| Head and neck | ||||||||||||
| Larynx | 2,306 | 16.0 | 3,943 | 27.3 | 1,967 | 27.6 | 3,325 | 46.7 | 339 | 4.6 | 618 | 8.5 |
| Oral cavity and pharynx | 9,534 | 66.1 | 14,908 | 103.3 | 6,694 | 94.0 | 10,253 | 143.9 | 2,840 | 38.9 | 4,655 | 63.7 |
| Lip and oral cavity | 4,664 | 32.3 | 7,566 | 52.4 | 2,870 | 40.3 | 4,722 | 66.3 | 1,794 | 24.6 | 2,844 | 38.9 |
| Hypopharynx | 299 | 2.1 | 404 | 2.8 | 244 | 3.4 | 318 | 4.5 | 55 | 0.8 | 86 | 1.2 |
| Nasopharynx | 742 | 5.1 | 1,455 | 10.1 | 515 | 7.2 | 986 | 13.8 | 227 | 3.1 | 469 | 6.4 |
| Oropharynx | 3,679 | 25.5 | 5,155 | 35.7 | 2,958 | 41.5 | 4,032 | 56.6 | 721 | 9.9 | 1,123 | 15.4 |
| Thyroid | 27,856 | 193.1 | 46,896 | 325.1 | 6,443 | 90.5 | 10,057 | 141.2 | 21,413 | 293.2 | 36,839 | 504.4 |
| Thyroid - anaplastic | 23 | 0.2 | 35 | 0.2 | 8 | 0.1 | 10 | 0.1 | 15 | 0.2 | 25 | 0.3 |
| Thyroid - follicular | 897 | 6.2 | 2,051 | 14.2 | 226 | 3.2 | 465 | 6.5 | 671 | 9.2 | 1,586 | 21.7 |
| Thyroid - medullary | 315 | 2.2 | 587 | 4.1 | 129 | 1.8 | 223 | 3.1 | 186 | 2.6 | 364 | 5.0 |
| Thyroid - papillary | 26,251 | 182.0 | 42,507 | 294.6 | 5,988 | 84.1 | 9,013 | 126.5 | 20,263 | 277.5 | 33,494 | 458.6 |
| Hematological | ||||||||||||
| Leukemia | 12,906 | 89.5 | 20,792 | 144.1 | 7,546 | 105.9 | 11,947 | 167.7 | 5,360 | 73.4 | 8,845 | 121.1 |
| Acute lymphocytic leukemia | 1,556 | 10.8 | 3,350 | 23.2 | 908 | 12.8 | 1,924 | 27.0 | 648 | 8.9 | 1,426 | 19.5 |
| Acute monocytic leukemia | 6,623 | 45.9 | 9,716 | 67.4 | 4,012 | 56.3 | 5,747 | 80.7 | 2,611 | 35.8 | 3,969 | 54.4 |
| Acute myeloid leukemia | 110 | 0.8 | 168 | 1.2 | 52 | 0.7 | 82 | 1.2 | 58 | 0.8 | 86 | 1.2 |
| Chronic lymphocytic leukemia | 1,588 | 11.0 | 2,591 | 18.0 | 810 | 11.4 | 1,294 | 18.2 | 778 | 10.7 | 1,297 | 17.8 |
| Chronic myeloid leukemia | 1,746 | 12.1 | 2,741 | 19.0 | 990 | 13.9 | 1,537 | 21.6 | 756 | 10.4 | 1,204 | 16.5 |
| Lymphoma | 26,749 | 185.4 | 43,277 | 300.0 | 14,461 | 203.0 | 22,939 | 322.0 | 12,288 | 168.3 | 20,338 | 278.5 |
| Hodgkin lymphoma | 3,269 | 22.7 | 7,762 | 53.8 | 1,737 | 24.4 | 4,065 | 57.1 | 1,532 | 21.0 | 3,697 | 50.6 |
| Non-Hodgkin lymphoma | 23,517 | 163.0 | 35,569 | 246.6 | 12,747 | 178.9 | 18,906 | 265.4 | 10,770 | 147.5 | 16,663 | 228.2 |
| Non-Hodgkin lymphoma - extranodal | 12,254 | 84.9 | 22,546 | 156.3 | 6,605 | 92.7 | 11,872 | 166.7 | 5,649 | 77.4 | 10,674 | 146.2 |
| Non-Hodgkin lymphoma - nodal | 11,282 | 78.2 | 13,049 | 90.5 | 6,155 | 86.4 | 7,052 | 99.0 | 5,127 | 70.2 | 5,997 | 82.1 |
| Myeloma | 6,170 | 42.8 | 7,489 | 51.9 | 3,417 | 48.0 | 4,099 | 57.5 | 2,753 | 37.7 | 3,390 | 46.4 |
| Melanoma | ||||||||||||
| Melanoma of the skin | 24,312 | 168.5 | 41,635 | 288.6 | 12,762 | 179.2 | 20,681 | 290.3 | 11,550 | 158.2 | 20,954 | 286.9 |
| Melanoma (non-cutaneous) | 1,016 | 7.0 | 1,711 | 11.9 | 503 | 7.1 | 857 | 12.0 | 513 | 7.0 | 854 | 11.7 |
| Melanoma - mucosal | 171 | 1.2 | 209 | 1.5 | 57 | 0.8 | 60 | 0.8 | 114 | 1.6 | 149 | 2.0 |
| Melanoma - ocular | 845 | 5.9 | 1,502 | 10.4 | 446 | 6.3 | 797 | 11.2 | 399 | 5.5 | 705 | 9.7 |
| Thoracic system | ||||||||||||
| Lung | 23,488 | 162.8 | 30,246 | 209.7 | 10,217 | 143.4 | 13,361 | 187.6 | 13,271 | 181.7 | 16,885 | 231.2 |
| Lung - adenocarcinoma | 12,243 | 84.9 | 15,007 | 104.0 | 4,714 | 66.2 | 5,721 | 80.3 | 7,529 | 103.1 | 9,286 | 127.2 |
| Lung - large cell | 347 | 2.4 | 543 | 3.8 | 172 | 2.4 | 267 | 3.8 | 175 | 2.4 | 276 | 3.8 |
| Lung - small cell | 1,304 | 9.0 | 1,628 | 11.3 | 576 | 8.1 | 738 | 10.4 | 728 | 10.0 | 890 | 12.2 |
| Lung - squamous cell | 4,262 | 29.5 | 5,447 | 37.8 | 2,526 | 35.5 | 3,299 | 46.3 | 1,736 | 23.8 | 2,148 | 29.4 |
| Urinary system | ||||||||||||
| Bladder | 11,312 | 78.4 | 18,908 | 131.1 | 8,915 | 125.2 | 14,494 | 203.5 | 2,397 | 32.8 | 4,414 | 60.4 |
| Kidney | 14,701 | 101.9 | 22,655 | 157.0 | 9,396 | 131.9 | 13,959 | 196.0 | 5,305 | 72.6 | 8,696 | 119.1 |
Symbols:
** Suppressed due to small cell count (count less than 6).
†Prevalence counts are based on the Surveillance, Epidemiology and End Results Program rules for counting multiple primary cancers and only reflects 9-year prevalence (2010 to 2018).
Notes:
- Prevalence counts are based on incidence using International Agency for Research on Cancer/International Association of Cancer Registries rules for counting multiple primaries.
- Prevalence proportions are per 100,000.
- Only the first cancer of a given type in an individual is counted (for people who have multiple episodes of cancer).
- Counts for cancer subsites may not sum to total because not all subsites are included.
Analysis by: Surveillance, Ontario Health (Cancer Care Ontario)
Data source: Ontario Cancer Registry (March, 2021), Ontario Health (Cancer Care Ontario)
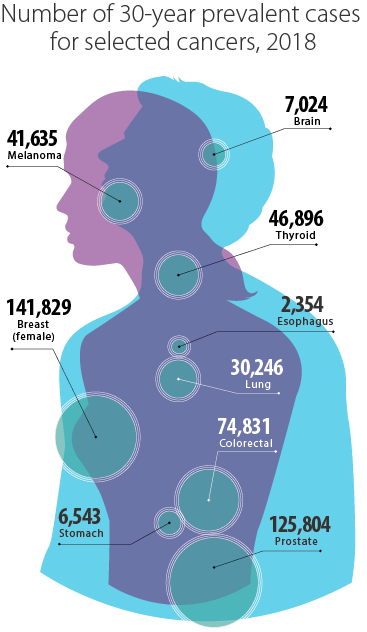
Female breast cancer was the largest contributor to 30-year prevalence, accounting for 141,829 survivors at the end of 2018 (Figure 7.1). Prostate (125,804) and colorectal (74,831) cancers were the next most prevalent types. Lung cancer, despite being the third most commonly diagnosed cancer, ranked only eighth in terms of prevalence because of its low survival. It was surpassed by several higher-survival cancers, despite their lower annual incidence: thyroid cancer, lymphoma, melanoma and uterine cancer.
Prevalence Trends by Cancer Type
The increase over time in 10-year prevalence for the most common cancers and all cancers combined is shown in Figure 7.2. The rate of increase in prevalence varied greatly by cancer type. The highest increases were for prostate and female breast cancers, which had higher survival, while the lowest were for colorectal and lung cancers.
Overall, the prevalence of all cancer types, except laryngeal, increased each decade from 1998 to 2008 to 2018 (Table 7.2). However, by sex, prevalence for some cancers was relatively stable.
Among females, prevalence of cervical and bladder cancers changed very little over the 3 periods, but for different reasons. For bladder cancer, incidence increased, while survival decreased. For cervical cancer, survival changed little over time (see Chapter 6: Cancer Survival).
Among males, the prevalence of laryngeal, lip and oral cavity cancers, as well as squamous cell carcinoma of the lung were relatively stable.
| Cancer type | Males and females combined | Males | Females | ||||||||||||||||||||||||||||||||
|---|---|---|---|---|---|---|---|---|---|---|---|---|---|---|---|---|---|---|---|---|---|---|---|---|---|---|---|---|---|---|---|---|---|---|---|
| Count (1998) | Proportion (1998) | Count (2008) | Proportion (2008) | Count (2018) | Proportion (2018) | Count (1998) | Proportion (1998) | Count (2008) | Proportion (2008) | Count (2018) | Proportion (2018) | Count (1998) | Proportion (1998) | Count (2008) | Proportion (2008) | Count (2018) | Proportion (2018) | ||||||||||||||||||
| All Cancers | 221,749 | 1,939.2 | 322,726 | 2,493.8 | 411,158 | 2,850.0 | 105,988 | 1,879.1 | 160,954 | 2,528.3 | 195,257 | 2,741.0 | 115,761 | 1,997.6 | 161,772 | 2,460.5 | 215,901 | 2,956.3 | |||||||||||||||||
| Brain and nervous system | |||||||||||||||||||||||||||||||||||
| Brain and other nervous system - malignant | 2,862 | 25.0 | 3,499 | 27.0 | 3,513 | 24.4 | 1,529 | 27.1 | 1,850 | 29.1 | 1,939 | 27.2 | 1,333 | 23.0 | 1,649 | 25.1 | 1,574 | 21.6 | |||||||||||||||||
| Glioblastoma | 366 | 3.2 | 519 | 4.0 | 846 | 5.9 | 213 | 3.8 | 304 | 4.8 | 493 | 6.9 | 153 | 2.6 | 215 | 3.3 | 353 | 4.8 | |||||||||||||||||
| All other gliomas | 1,336 | 11.7 | 1,574 | 12.2 | 1,720 | 11.9 | 739 | 13.1 | 817 | 12.8 | 938 | 13.2 | 597 | 10.3 | 757 | 11.5 | 782 | 10.7 | |||||||||||||||||
| Brain and other nervous system - non-malignant† | n/a | n/a | n/a | n/a | 15,910 | 110.3 | n/a | n/a | n/a | n/a | 6,443 | 90.5 | n/a | n/a | n/a | n/a | 9,467 | 129.6 | |||||||||||||||||
| Meningiomas† | n/a | n/a | n/a | n/a | 5,113 | 35.4 | n/a | n/a | n/a | n/a | 1,468 | 20.6 | n/a | n/a | n/a | n/a | 3,645 | 49.9 | |||||||||||||||||
| Pituitary, pineal and craniopharyngeal duct† | n/a | n/a | n/a | n/a | 4,119 | 28.6 | n/a | n/a | n/a | n/a | 1,996 | 28.0 | n/a | n/a | n/a | n/a | 2,123 | 29.1 | |||||||||||||||||
| Breast and genital system | |||||||||||||||||||||||||||||||||||
| Breast (female) | n/a | n/a | n/a | n/a | n/a | n/a | n/a | n/a | n/a | n/a | n/a | n/a | 46,149 | 796.4 | 61,593 | 936.8 | 78,182 | 1,070.5 | |||||||||||||||||
| Cervix | n/a | n/a | n/a | n/a | n/a | n/a | n/a | n/a | n/a | n/a | n/a | n/a | 4,078 | 70.4 | 3,982 | 60.6 | 4,285 | 58.7 | |||||||||||||||||
| Ovary | n/a | n/a | n/a | n/a | n/a | n/a | n/a | n/a | n/a | n/a | n/a | n/a | 3,606 | 62.2 | 4,972 | 75.6 | 5,810 | 79.6 | |||||||||||||||||
| Prostate | n/a | n/a | n/a | n/a | n/a | n/a | 38,483 | 682.3 | 69,338 | 1,089.2 | 72,124 | 1,012.5 | n/a | n/a | n/a | n/a | n/a | n/a | |||||||||||||||||
| Testis | n/a | n/a | n/a | n/a | n/a | n/a | 2,545 | 45.1 | 3,167 | 49.8 | 3,835 | 53.8 | n/a | n/a | n/a | n/a | n/a | n/a | |||||||||||||||||
| Uterine | n/a | n/a | n/a | n/a | n/a | n/a | n/a | n/a | n/a | n/a | n/a | n/a | 8,687 | 149.9 | 12,073 | 183.6 | 19,749 | 270.4 | |||||||||||||||||
| Uterus - endometrial | n/a | n/a | n/a | n/a | n/a | n/a | n/a | n/a | n/a | n/a | n/a | n/a | 7,697 | 132.8 | 10,925 | 166.2 | 18,757 | 256.8 | |||||||||||||||||
| Uterus - uterine sarcoma | n/a | n/a | n/a | n/a | n/a | n/a | n/a | n/a | n/a | n/a | n/a | n/a | 268 | 4.6 | 349 | 5.3 | 392 | 5.4 | |||||||||||||||||
| Digestive system | |||||||||||||||||||||||||||||||||||
| Colorectal | 27,793 | 243.1 | 39,536 | 305.5 | 45,542 | 315.7 | 14,296 | 253.5 | 21,265 | 334.0 | 24,836 | 348.7 | 13,497 | 232.9 | 18,271 | 277.9 | 20,706 | 283.5 | |||||||||||||||||
| Colon excluding rectum | 18,935 | 165.6 | 26,083 | 201.6 | 30,158 | 209.0 | 9,128 | 161.8 | 13,104 | 205.8 | 15,586 | 218.8 | 9,807 | 169.2 | 12,979 | 197.4 | 14,572 | 199.5 | |||||||||||||||||
| Colon - left sided | 8,216 | 71.9 | 11,307 | 87.4 | 12,366 | 85.7 | 4,353 | 77.2 | 6,301 | 99.0 | 7,082 | 99.4 | 3,863 | 66.7 | 5,006 | 76.1 | 5,284 | 72.4 | |||||||||||||||||
| Colon - right sided | 9,414 | 82.3 | 13,712 | 106.0 | 17,199 | 119.2 | 4,105 | 72.8 | 6,223 | 97.8 | 8,178 | 114.8 | 5,309 | 91.6 | 7,489 | 113.9 | 9,021 | 123.5 | |||||||||||||||||
| Rectum and rectosigmoid junction | 8,991 | 78.6 | 13,685 | 105.8 | 16,306 | 113.0 | 5,240 | 92.9 | 8,300 | 130.4 | 9,826 | 137.9 | 3,751 | 64.7 | 5,385 | 81.9 | 6,480 | 88.7 | |||||||||||||||||
| Rectosigmoid junction | 2,821 | 24.7 | 4,268 | 33.0 | 4,077 | 28.3 | 1,573 | 27.9 | 2,457 | 38.6 | 2,441 | 34.3 | 1,248 | 21.5 | 1,811 | 27.5 | 1,636 | 22.4 | |||||||||||||||||
| Rectum | 6,170 | 54.0 | 9,417 | 72.8 | 12,229 | 84.8 | 3,667 | 65.0 | 5,843 | 91.8 | 7,385 | 103.7 | 2,503 | 43.2 | 3,574 | 54.4 | 4,844 | 66.3 | |||||||||||||||||
| Esophagus | 837 | 7.3 | 1,176 | 9.1 | 1,828 | 12.7 | 560 | 9.9 | 856 | 13.5 | 1,390 | 19.5 | 277 | 4.8 | 320 | 4.9 | 438 | 6.0 | |||||||||||||||||
| Esophagus - adenocarcinoma | 341 | 3.0 | 626 | 4.8 | 1,152 | 8.0 | 288 | 5.1 | 530 | 8.3 | 992 | 13.9 | 53 | 0.9 | 96 | 1.5 | 160 | 2.2 | |||||||||||||||||
| Esophagus - squamous cell carcinoma | 403 | 3.5 | 415 | 3.2 | 544 | 3.8 | 222 | 3.9 | 231 | 3.6 | 308 | 4.3 | 181 | 3.1 | 184 | 2.8 | 236 | 3.2 | |||||||||||||||||
| Liver | 613 | 5.4 | 1,638 | 12.7 | 2,992 | 20.7 | 421 | 7.5 | 1,207 | 19.0 | 2,186 | 30.7 | 192 | 3.3 | 431 | 6.6 | 806 | 11.0 | |||||||||||||||||
| Pancreas | 1,099 | 9.6 | 1,663 | 12.9 | 2,963 | 20.5 | 519 | 9.2 | 805 | 12.7 | 1,524 | 21.4 | 580 | 10.0 | 858 | 13.1 | 1,439 | 19.7 | |||||||||||||||||
| Stomach | 2,528 | 22.1 | 3,202 | 24.7 | 4,864 | 33.7 | 1,549 | 27.5 | 1,932 | 30.4 | 2,997 | 42.1 | 979 | 16.9 | 1,270 | 19.3 | 1,867 | 25.6 | |||||||||||||||||
| Head and neck | |||||||||||||||||||||||||||||||||||
| Larynx | 2,395 | 20.9 | 2,337 | 18.1 | 2,306 | 16.0 | 1,978 | 35.1 | 1,953 | 30.7 | 1,967 | 27.6 | 417 | 7.2 | 384 | 5.8 | 339 | 4.6 | |||||||||||||||||
| Oral cavity and pharynx | 5,557 | 48.6 | 6,711 | 51.9 | 9,534 | 66.1 | 3,778 | 67.0 | 4,560 | 71.6 | 6,694 | 94.0 | 1,779 | 30.7 | 2,151 | 32.7 | 2,840 | 38.9 | |||||||||||||||||
| Lip and oral cavity | 3,358 | 29.4 | 3,429 | 26.5 | 4,664 | 32.3 | 2,297 | 40.7 | 2,162 | 34.0 | 2,870 | 40.3 | 1,061 | 18.3 | 1,267 | 19.3 | 1,794 | 24.6 | |||||||||||||||||
| Hypopharynx | 259 | 2.3 | 260 | 2.0 | 299 | 2.1 | 202 | 3.6 | 202 | 3.2 | 244 | 3.4 | 57 | 1.0 | 58 | 0.9 | 55 | 0.8 | |||||||||||||||||
| Nasopharynx | 489 | 4.3 | 666 | 5.2 | 742 | 5.1 | 326 | 5.8 | 450 | 7.1 | 515 | 7.2 | 163 | 2.8 | 216 | 3.3 | 227 | 3.1 | |||||||||||||||||
| Oropharynx | 1,113 | 9.7 | 2,057 | 15.9 | 3,679 | 25.5 | 756 | 13.4 | 1,557 | 24.5 | 2,958 | 41.5 | 357 | 6.2 | 500 | 7.6 | 721 | 9.9 | |||||||||||||||||
| Thyroid | 5,785 | 50.6 | 15,599 | 120.5 | 27,856 | 193.1 | 1,271 | 22.5 | 3,121 | 49.0 | 6,443 | 90.5 | 4,514 | 77.9 | 12,478 | 189.8 | 21,413 | 293.2 | |||||||||||||||||
| Thyroid - anaplastic | 8 | 0.1 | 14 | 0.1 | 23 | 0.2 | 1 | 0.0 | 4 | 0.1 | 8 | 0.1 | 7 | 0.1 | 10 | 0.2 | 15 | 0.2 | |||||||||||||||||
| Thyroid - follicular | 653 | 5.7 | 808 | 6.2 | 897 | 6.2 | 156 | 2.8 | 190 | 3.0 | 226 | 3.2 | 497 | 8.6 | 618 | 9.4 | 671 | 9.2 | |||||||||||||||||
| Thyroid - medullary | 134 | 1.2 | 223 | 1.7 | 315 | 2.2 | 55 | 1.0 | 81 | 1.3 | 129 | 1.8 | 79 | 1.4 | 142 | 2.2 | 186 | 2.6 | |||||||||||||||||
| Thyroid - papillary | 4,515 | 39.5 | 13,448 | 103.9 | 26,251 | 182.0 | 954 | 16.9 | 2,637 | 41.4 | 5,988 | 84.1 | 3,561 | 61.5 | 10,811 | 164.4 | 20,263 | 277.5 | |||||||||||||||||
| Hematological | |||||||||||||||||||||||||||||||||||
| Leukemia | 6,090 | 53.3 | 9,506 | 73.5 | 12,906 | 89.5 | 3,419 | 60.6 | 5,558 | 87.3 | 7,546 | 105.9 | 2,671 | 46.1 | 3,948 | 60.1 | 5,360 | 73.4 | |||||||||||||||||
| Acute lymphocytic leukemia | 944 | 8.3 | 1,133 | 8.8 | 1,556 | 10.8 | 526 | 9.3 | 664 | 10.4 | 908 | 12.8 | 418 | 7.2 | 469 | 7.1 | 648 | 8.9 | |||||||||||||||||
| Acute monocytic leukemia | 2,976 | 26.0 | 5,146 | 39.8 | 6,623 | 45.9 | 1,676 | 29.7 | 3,082 | 48.4 | 4,012 | 56.3 | 1,300 | 22.4 | 2,064 | 31.4 | 2,611 | 35.8 | |||||||||||||||||
| Acute myeloid leukemia | 40 | 0.4 | 54 | 0.4 | 110 | 0.8 | 19 | 0.3 | 31 | 0.5 | 52 | 0.7 | 21 | 0.4 | 23 | 0.4 | 58 | 0.8 | |||||||||||||||||
| Chronic lymphocytic leukemia | 702 | 6.1 | 1,095 | 8.5 | 1,588 | 11.0 | 334 | 5.9 | 563 | 8.8 | 810 | 11.4 | 368 | 6.4 | 532 | 8.1 | 778 | 10.7 | |||||||||||||||||
| Chronic myeloid leukemia | 707 | 6.2 | 1,121 | 8.7 | 1,746 | 12.1 | 426 | 7.6 | 617 | 9.7 | 990 | 13.9 | 281 | 4.9 | 504 | 7.7 | 756 | 10.4 | |||||||||||||||||
| Lymphoma | 11,629 | 101.7 | 17,211 | 133.0 | 26,749 | 185.4 | 6,013 | 106.6 | 9,057 | 142.3 | 14,461 | 203.0 | 5,616 | 96.9 | 8,154 | 124.0 | 12,288 | 168.3 | |||||||||||||||||
| Hodgkin lymphoma | 2,649 | 23.2 | 2,917 | 22.5 | 3,269 | 22.7 | 1,422 | 25.2 | 1,554 | 24.4 | 1,737 | 24.4 | 1,227 | 21.2 | 1,363 | 20.7 | 1,532 | 21.0 | |||||||||||||||||
| Non-Hodgkin lymphoma | 8,980 | 78.5 | 14,299 | 110.5 | 23,517 | 163.0 | 4,591 | 81.4 | 7,505 | 117.9 | 12,747 | 178.9 | 4,389 | 75.7 | 6,794 | 103.3 | 10,770 | 147.5 | |||||||||||||||||
| Non-Hodgkin lymphoma - extranodal | 8,236 | 72.0 | 12,176 | 94.1 | 12,254 | 84.9 | 4,186 | 74.2 | 6,393 | 100.4 | 6,605 | 92.7 | 4,050 | 69.9 | 5,783 | 88.0 | 5,649 | 77.4 | |||||||||||||||||
| Non-Hodgkin lymphoma - nodal | 744 | 6.5 | 2,125 | 16.4 | 11,282 | 78.2 | 405 | 7.2 | 1,114 | 17.5 | 6,155 | 86.4 | 339 | 5.9 | 1,011 | 15.4 | 5,127 | 70.2 | |||||||||||||||||
| Myeloma | 2,160 | 18.9 | 3,243 | 25.1 | 6,170 | 42.8 | 1,098 | 19.5 | 1,747 | 27.4 | 3,417 | 48.0 | 1,062 | 18.3 | 1,496 | 22.8 | 2,753 | 37.7 | |||||||||||||||||
| Melanoma | |||||||||||||||||||||||||||||||||||
| Melanoma of the skin | 10,318 | 90.2 | 15,691 | 121.3 | 24,312 | 168.5 | 5,066 | 89.8 | 7,936 | 124.7 | 12,762 | 179.2 | 5,252 | 90.6 | 7,755 | 118.0 | 11,550 | 158.2 | |||||||||||||||||
| Melanoma (non-cutaneous) | 561 | 4.9 | 728 | 5.6 | 1,016 | 7.0 | 276 | 4.9 | 361 | 5.7 | 503 | 7.1 | 285 | 4.9 | 367 | 5.6 | 513 | 7.0 | |||||||||||||||||
| Melanoma - mucosal | 34 | 0.3 | 48 | 0.4 | 171 | 1.2 | 5 | 0.1 | 5 | 0.1 | 57 | 0.8 | 29 | 0.5 | 43 | 0.7 | 114 | 1.6 | |||||||||||||||||
| Melanoma - ocular | 527 | 4.6 | 680 | 5.3 | 845 | 5.9 | 271 | 4.8 | 356 | 5.6 | 446 | 6.3 | 256 | 4.4 | 324 | 4.9 | 399 | 5.5 | |||||||||||||||||
| Thoracic system | |||||||||||||||||||||||||||||||||||
| Lung | 12,530 | 109.6 | 15,222 | 117.6 | 23,488 | 162.8 | 6,970 | 123.6 | 7,279 | 114.3 | 10,217 | 143.4 | 5,560 | 96.0 | 7,943 | 120.8 | 13,271 | 181.7 | |||||||||||||||||
| Lung - adenocarcinoma | 4,590 | 40.1 | 6,052 | 46.8 | 12,243 | 84.9 | 2,099 | 37.2 | 2,419 | 38.0 | 4,714 | 66.2 | 2,491 | 43.0 | 3,633 | 55.3 | 7,529 | 103.1 | |||||||||||||||||
| Lung - large cell | 467 | 4.1 | 403 | 3.1 | 347 | 2.4 | 251 | 4.5 | 197 | 3.1 | 172 | 2.4 | 216 | 3.7 | 206 | 3.1 | 175 | 2.4 | |||||||||||||||||
| Lung - small cell | 972 | 8.5 | 1,080 | 8.4 | 1,304 | 9.0 | 514 | 9.1 | 525 | 8.3 | 576 | 8.1 | 458 | 7.9 | 555 | 8.4 | 728 | 10.0 | |||||||||||||||||
| Lung - squamous cell | 3,291 | 28.8 | 2,984 | 23.1 | 4,262 | 29.5 | 2,313 | 41.0 | 1,912 | 30.0 | 2,526 | 35.5 | 978 | 16.9 | 1,072 | 16.3 | 1,736 | 23.8 | |||||||||||||||||
| Urinary system | |||||||||||||||||||||||||||||||||||
| Bladder | 9,581 | 83.8 | 10,795 | 83.4 | 11,312 | 78.4 | 7,175 | 127.2 | 8,237 | 129.4 | 8,915 | 125.2 | 2,406 | 41.5 | 2,558 | 38.9 | 2,397 | 32.8 | |||||||||||||||||
| Kidney | 5,729 | 50.1 | 9,025 | 69.7 | 14,701 | 101.9 | 3,408 | 60.4 | 5,370 | 84.4 | 9,396 | 131.9 | 2,321 | 40.1 | 3,655 | 55.6 | 5,305 | 72.6 | |||||||||||||||||
Symbols:
** Suppressed due to small cell count (count less than 6).
†Prevalence counts are based on the Surveillance, Epidemiology and End Results Program rules for counting multiple primary cancers and only reflects 9-year prevalence (2010 to 2018).
Notes:
- Prevalence counts are based on incidence counts using International Agency for Research on Cancer/International Association of Cancer Registries rules for counting multiple primaries.
- Prevalence proportions are per 100,000.
- Only the first cancer of a given type in an individual is counted (for people who have multiple episodes of cancer).
- Counts for cancer subsites may not sum to total because not all subsites are included.
Analysis by: Surveillance, Ontario Health (Cancer Care Ontario)
Data source: Ontario Cancer Registry (March 2021), Ontario Health (Cancer Care Ontario)
Prevalence by Age
The majority (51.7%) of 30-year prevalent cancers in 2018 were among people in Ontario ages 60 to 79, followed by those age 80 and older (22.3%) (Table 7.3). However, prevalence patterns differed according to sex. Although males had the same pattern as males and females combined, the second-highest prevalence for females was among people ages 40 to 59. This difference is largely due to the higher prevalence of melanoma, as well as breast, cervical, thyroid and ovarian cancers among females in that age group.
Among people ages 0 to 39, females were more likely than males to be living with cancer. Notable patterns in this age group include a higher prevalence than people over age 39 of brain cancer, which has a higher survival rate in younger people.
Table 7.3 Thirty-year prevalence by cancer type, sex and age group, Ontario, 2018
Males and females combined
| Cancer type | Counts (ages 0 to 39) |
Proportion (ages 0 to 39) |
Counts (ages 40 to 59) |
Proportion (ages 40 to 59) |
Counts (ages 60 to 79) |
Proportion (ages 60 to 79) |
Counts (age 80 and older) |
Proportion (age 80 and older) |
|---|---|---|---|---|---|---|---|---|
| All cancers | 31,938 | 448.9 | 143,646 | 3,664.5 | 349,824 | 12,678.9 | 151,101 | 23,872.6 |
| Bladder | 76 | 1.1 | 1,420 | 36.2 | 9,704 | 351.7 | 7,708 | 1,217.8 |
| Brain | 2,648 | 37.2 | 2,205 | 56.3 | 1,750 | 63.4 | 421 | 66.5 |
| Breast (female) | n/a | n/a | n/a | n/a | n/a | n/a | n/a | n/a |
| Cervix | n/a | n/a | n/a | n/a | n/a | n/a | n/a | n/a |
| Colorectal | 684 | 9.6 | 10,009 | 255.3 | 37,945 | 1,375.3 | 26,193 | 4,138.3 |
| Esophagus | 17 | 0.2 | 389 | 9.9 | 1,439 | 52.2 | 509 | 80.4 |
| Hodgkin lymphoma | 2,709 | 38.1 | 3,340 | 85.2 | 1,434 | 52.0 | 279 | 44.1 |
| Kidney | 909 | 12.8 | 5,306 | 135.4 | 12,405 | 449.6 | 4,035 | 637.5 |
| Larynx | 22 | 0.3 | 473 | 12.1 | 2,354 | 85.3 | 1,094 | 172.8 |
| Leukemia | 4,000 | 56.2 | 3,699 | 94.4 | 9,157 | 331.9 | 3,936 | 621.9 |
| Liver | 179 | 2.5 | 668 | 17.0 | 2,392 | 86.7 | 716 | 113.1 |
| Lung | 217 | 3.1 | 3,263 | 83.2 | 18,542 | 672.0 | 8,224 | 1,299.3 |
| Melanoma | 2,034 | 28.6 | 10,932 | 278.9 | 20,326 | 736.7 | 8,343 | 1,318.1 |
| Myeloma | 50 | 0.7 | 1,240 | 31.6 | 4,301 | 155.9 | 1,898 | 299.9 |
| Non-Hodgkin lymphoma | 2,161 | 30.4 | 7,863 | 200.6 | 18,038 | 653.8 | 7,507 | 1,186.0 |
| Oral cavity and pharynx | 306 | 4.3 | 3,677 | 93.8 | 8,483 | 307.5 | 2,442 | 385.8 |
| Ovary | n/a | n/a | n/a | n/a | n/a | n/a | n/a | n/a |
| Pancreas | 99 | 1.4 | 787 | 20.1 | 2,126 | 77.1 | 775 | 122.4 |
| Prostate | n/a | n/a | n/a | n/a | n/a | n/a | n/a | n/a |
| Stomach | 95 | 1.3 | 1,208 | 30.8 | 3,657 | 132.5 | 2,160 | 341.3 |
| Testis | n/a | n/a | n/a | n/a | n/a | n/a | n/a | n/a |
| Thyroid | 5,368 | 75.5 | 21,267 | 542.5 | 17,317 | 627.6 | 2,944 | 465.1 |
| Uterus | n/a | n/a | n/a | n/a | n/a | n/a | n/a | n/a |
Males
| Cancer type | Counts (ages 0 to 39) |
Proportion (ages 0 to 39) |
Counts (ages 40 to 59) |
Proportion (ages 40 to 59) |
Counts (ages 60 to 79) |
Proportion (ages 60 to 79) |
Counts (age 80 and older) |
Proportion (age 80 and older) |
|---|---|---|---|---|---|---|---|---|
| All cancers | 14,077 | 388.1 | 50,366 | 2,610.7 | 170,875 | 13,003.5 | 77,482 | 30,654.3 |
| Bladder | 43 | 1.2 | 1,087 | 56.3 | 7,550 | 574.6 | 5,814 | 2,300.2 |
| Brain | 1,456 | 40.1 | 1,194 | 61.9 | 897 | 68.3 | 177 | 70.0 |
| Breast (female) | n/a | n/a | n/a | n/a | n/a | n/a | n/a | n/a |
| Cervix | n/a | n/a | n/a | n/a | n/a | n/a | n/a | n/a |
| Colorectal | 345 | 9.5 | 5,373 | 278.5 | 21,656 | 1,648.0 | 12,577 | 4,975.9 |
| Esophagus | ** | ** | †290 | 15.1 | 1,102 | 83.9 | 331 | 131.0 |
| Hodgkin lymphoma | 1,385 | 38.2 | 1,755 | 91.0 | 780 | 59.4 | 145 | 57.4 |
| Kidney | 456 | 12.6 | 3,439 | 178.3 | 7,801 | 593.7 | 2,263 | 895.3 |
| Larynx | 12 | 0.3 | 376 | 19.5 | 2,007 | 152.7 | 930 | 367.9 |
| Leukemia | 2,256 | 62.2 | 2,116 | 109.7 | 5,531 | 420.9 | 2,044 | 808.7 |
| Liver | 114 | 3.1 | 475 | 24.6 | 1,838 | 139.9 | 457 | 180.8 |
| Lung | 95 | 2.6 | 1,298 | 67.3 | 8,100 | 616.4 | 3,868 | 1,530.3 |
| Melanoma | 688 | 19.0 | 4,615 | 239.2 | 10,826 | 823.9 | 4,552 | 1,800.9 |
| Myeloma | 27 | 0.7 | 677 | 35.1 | 2,415 | 183.8 | 980 | 387.7 |
| Non-Hodgkin lymphoma | 1,313 | 36.2 | 4,366 | 226.3 | 9,728 | 740.3 | 3,499 | 1,384.3 |
| Oral cavity and pharynx | 176 | 4.9 | 2,585 | 134.0 | 6,082 | 462.8 | 1,410 | 557.8 |
| Ovary | n/a | n/a | n/a | n/a | n/a | n/a | n/a | n/a |
| Pancreas | 36 | 1.0 | 381 | 19.8 | 1,130 | 86.0 | 354 | 140.1 |
| Prostate | 14 | 0.4 | 7,272 | 376.9 | 78,675 | 5,987.1 | 39,843 | 15,763.1 |
| Stomach | 39 | 1.1 | 694 | 36.0 | 2,305 | 175.4 | 1,265 | 500.5 |
| Testis | 2,719 | 75.0 | 4,773 | 247.4 | 1,497 | 113.9 | 98 | 38.8 |
| Thyroid | 1,038 | 28.6 | 4,143 | 214.8 | 4,149 | 315.7 | 727 | 287.6 |
| Uterus | n/a | n/a | n/a | n/a | n/a | n/a | n/a | n/a |
Females
| Cancer type | Counts (ages 0 to 39) |
Proportion (ages 0 to 39) |
Counts (ages 40 to 59) |
Proportion (ages 40 to 59) |
Counts (ages 60 to 79) |
Proportion (ages 60 to 79) |
Counts (age 80 and older) |
Proportion (age 80 and older) |
|---|---|---|---|---|---|---|---|---|
| All cancers | 17,861 | 512.2 | 93,280 | 4,685.6 | 178,949 | 12,383.7 | 73,619 | 19,363.9 |
| Bladder | 33 | 1.0 | 333 | 16.7 | 2,154 | 149.1 | 1,894 | 498.2 |
| Brain | 1,192 | 34.2 | 1,011 | 50.8 | 853 | 59.0 | 244 | 64.2 |
| Breast (female) | 1,974 | 56.6 | 34,592 | 1,737.6 | 76,473 | 5,292.1 | 28,790 | 7,572.6 |
| Cervix | 956 | 27.4 | 4,915 | 246.9 | 3,691 | 255.4 | 744 | 195.7 |
| Colorectal | 339 | 9.7 | 4,636 | 232.9 | 16,289 | 1,127.2 | 13,616 | 3,581.4 |
| Esophagus | ** | ** | †95 | 4.9 | 337 | 23.3 | 178 | 46.8 |
| Hodgkin lymphoma | 1,324 | 38.0 | 1,585 | 79.6 | 654 | 45.3 | 134 | 35.3 |
| Kidney | 453 | 13.0 | 1,867 | 93.8 | 4,604 | 318.6 | 1,772 | 466.1 |
| Larynx | 10 | 0.3 | 97 | 4.9 | 347 | 24.0 | 164 | 43.1 |
| Leukemia | 1,744 | 50.0 | 1,583 | 79.5 | 3,626 | 250.9 | 1,892 | 497.7 |
| Liver | 65 | 1.9 | 193 | 9.7 | 554 | 38.3 | 259 | 68.1 |
| Lung | 122 | 3.5 | 1,965 | 98.7 | 10,442 | 722.6 | 4,356 | 1,145.8 |
| Melanoma | 1,346 | 38.6 | 6,317 | 317.3 | 9,500 | 657.4 | 3,791 | 997.1 |
| Myeloma | 23 | 0.7 | 563 | 28.3 | 1,886 | 130.5 | 918 | 241.5 |
| Non-Hodgkin lymphoma | 848 | 24.3 | 3,497 | 175.7 | 8,310 | 575.1 | 4,008 | 1,054.2 |
| Oral cavity and pharynx | 130 | 3.7 | 1,092 | 54.9 | 2,401 | 166.2 | 1,032 | 271.5 |
| Ovary | 710 | 20.4 | 3,184 | 159.9 | 4,965 | 343.6 | 1,418 | 373.0 |
| Pancreas | 63 | 1.8 | 406 | 20.4 | 996 | 68.9 | 421 | 110.7 |
| Prostate | n/a | n/a | n/a | n/a | n/a | n/a | n/a | n/a |
| Stomach | 56 | 1.6 | 514 | 25.8 | 1,352 | 93.6 | 895 | 235.4 |
| Testis | n/a | n/a | n/a | n/a | n/a | n/a | n/a | n/a |
| Thyroid | 4,330 | 124.2 | 17,124 | 860.2 | 13,168 | 911.3 | 2,217 | 583.1 |
| Uterus | 264 | 7.6 | 5,670 | 284.8 | 19,798 | 1,370.1 | 6,706 | 1,763.9 |
Abbreviation: n/a means not applicable
Symbols:
**Suppressed due to small cell count (count less than 6).
†Count has been rounded to ensure confidentiality.
Notes:
- Prevalence counts are based on incidence counts using International Agency for Research on Cancer/International Association of Cancer Registries rules for counting multiple primaries.
- Prevalence proportions are per 100,000
Analysis by: Surveillance, Ontario Health (Cancer Care Ontario)
Data source: Ontario Cancer Registry (March 2021), Ontario Health (Cancer Care Ontario)