You are using an outdated browser. We suggest you update your browser for a better experience. Click here for update.
Close this notification.
Skip to main content Skip to search
Statistical Reports

Ontario Cancer Statistics 2018

Jan 2018
Data Type: Surveillance
Publication Series: Ontario Cancer Statistics

For the most recent edition of this report, see Ontario Cancer Statistics 2022.

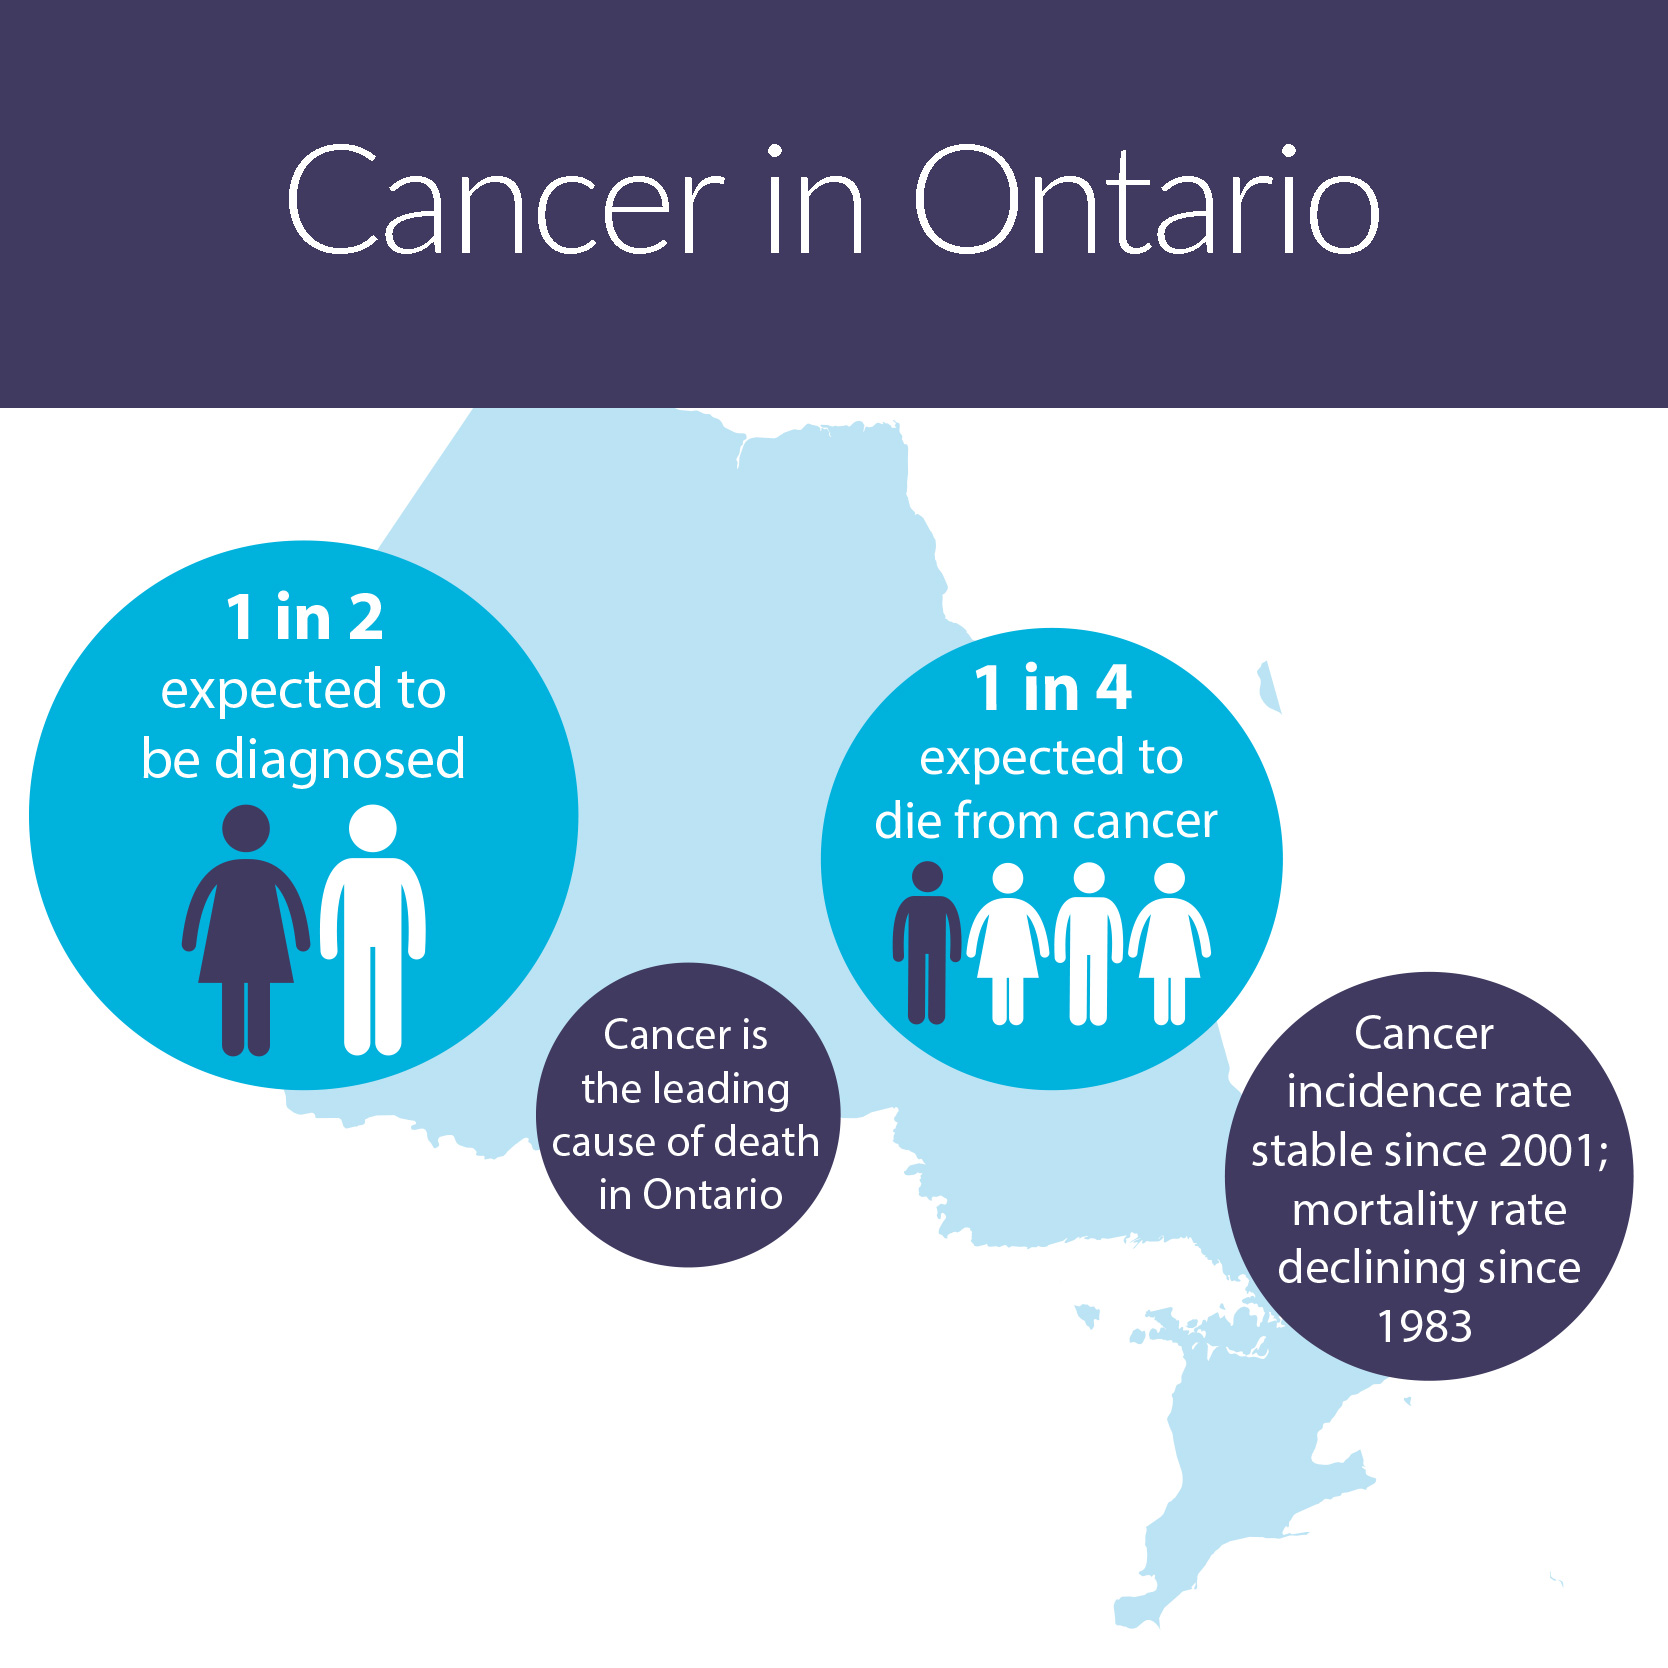
Ontario Cancer Statistics 2018 is the second in a series of comprehensive reports that describe the changing burden of cancer in Ontario. Reporting on over 30 years of data from the Ontario Cancer Registry and other data sources, it focuses on the incidence, mortality, survival and prevalence of 23 of the most common cancers in Ontario.

For the first time in this report series, emerging issues in cancer control are examined and additional cancer statistics are provided for public health units. Statistics on clinically relevant indicators for selected cancers were examined in the Ontario Cancer Statistics 2016 report, available for download in the side bar.

The Ontario Cancer Statistics 2018 report was updated in April 2019 with corrections. See the errata for more information. Download Table 5.3.

Highlights of the Report

  • Organized into 8 key chapters each of which can be downloaded individually.
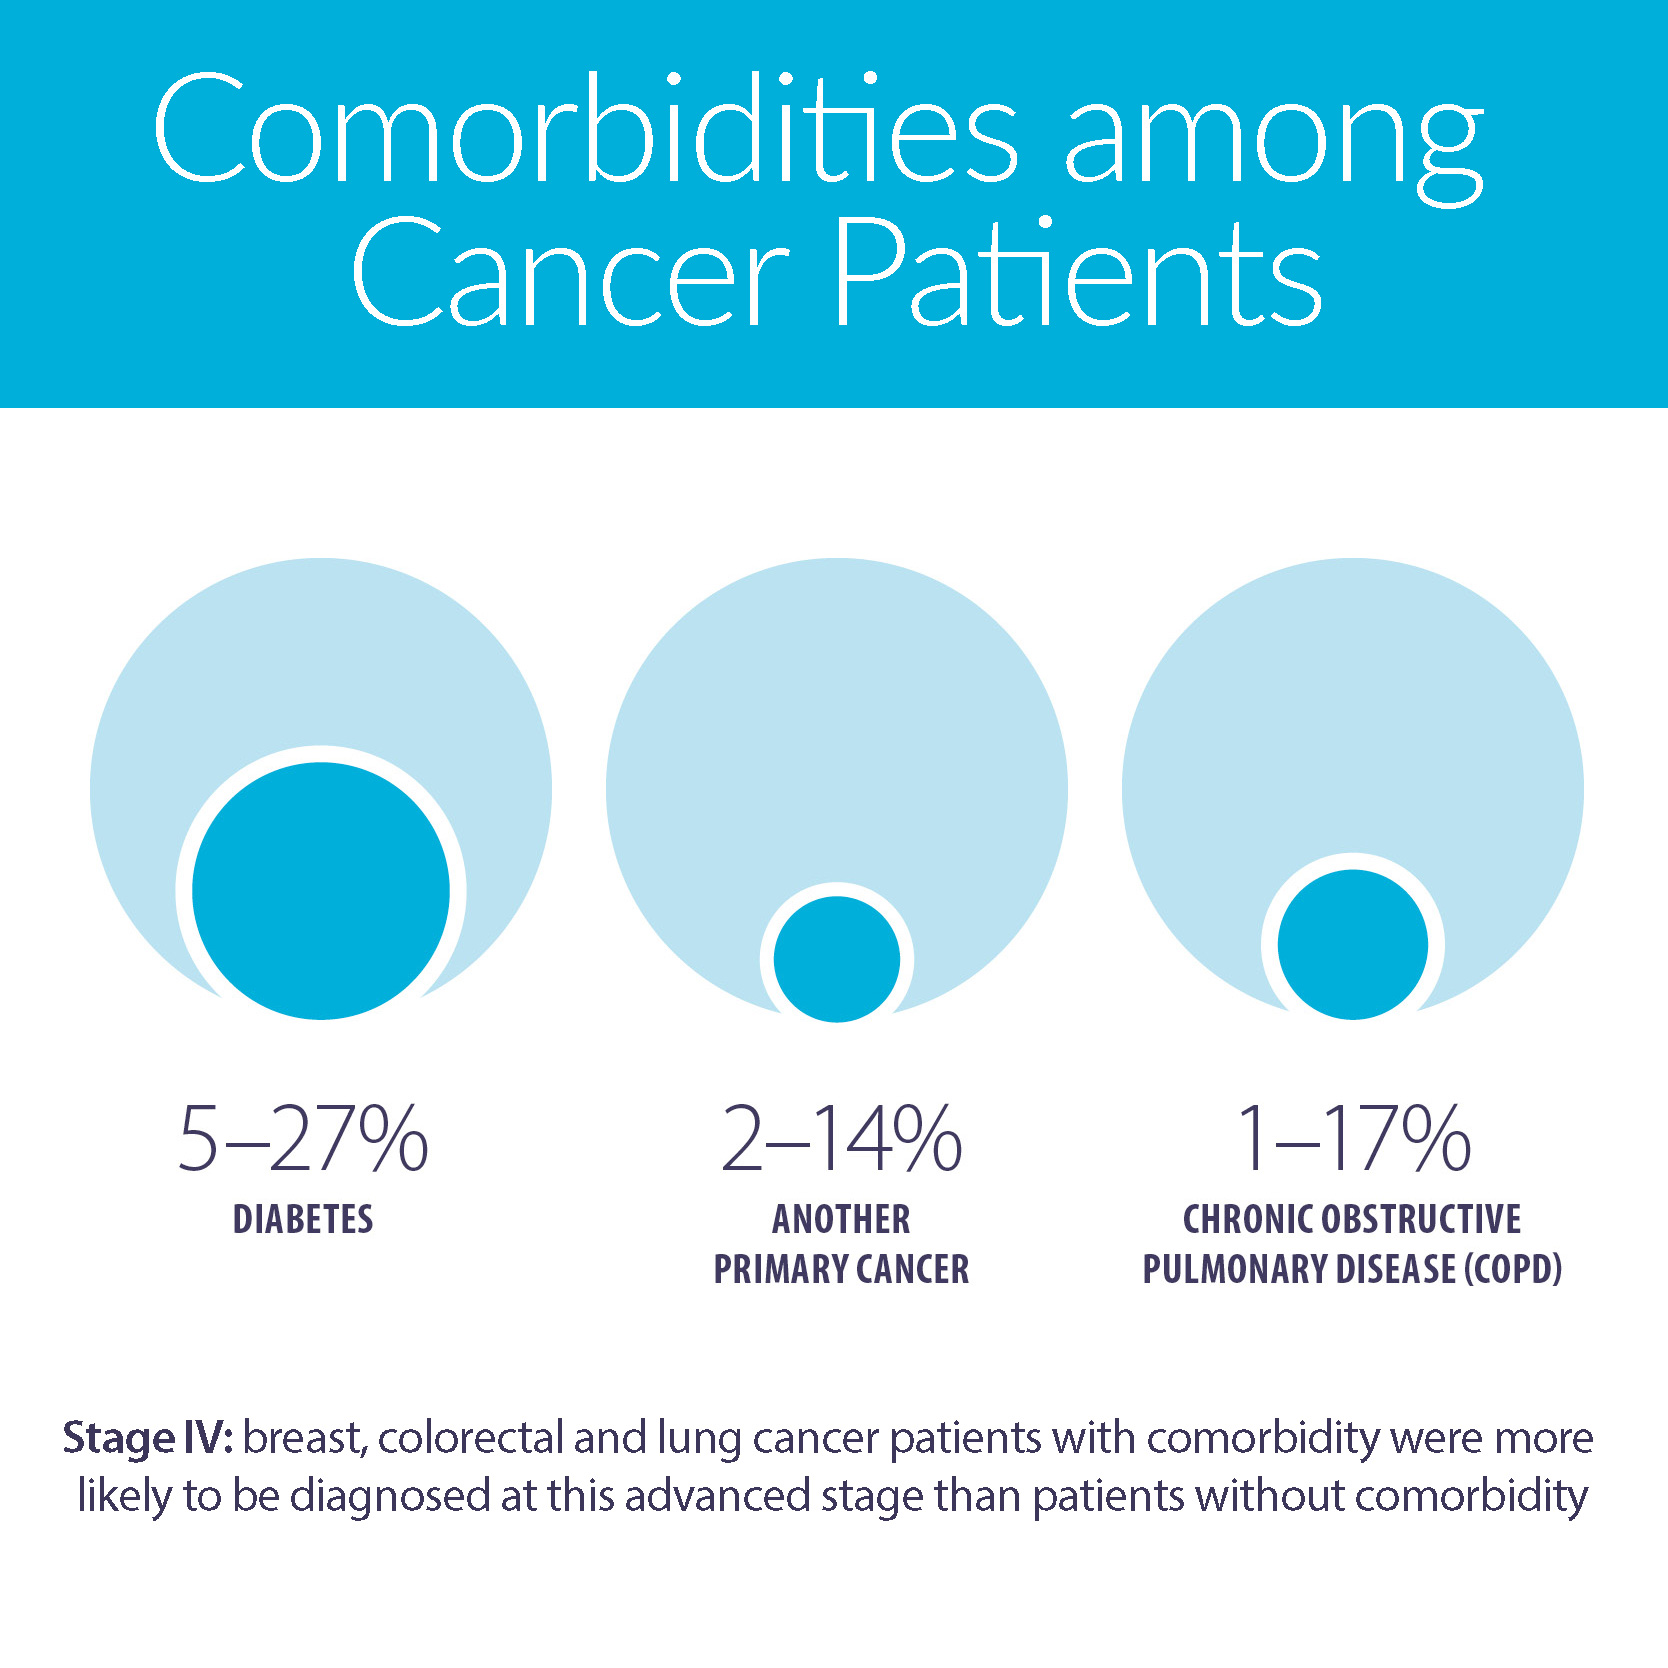
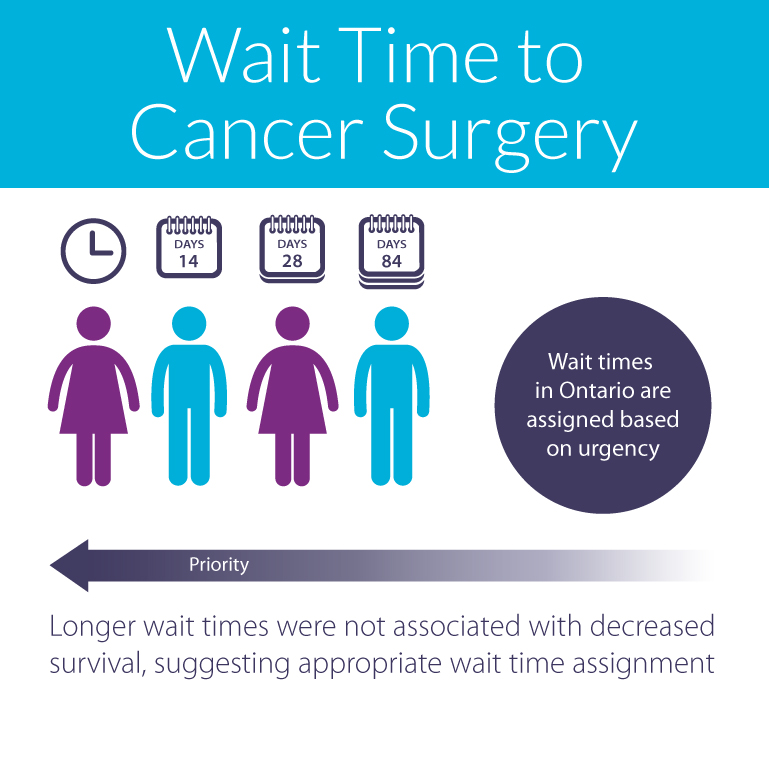
  • Special focus on the burden of comorbidity among individuals with cancer and the impact of wait times to surgical treatment on survival for selected cancers.
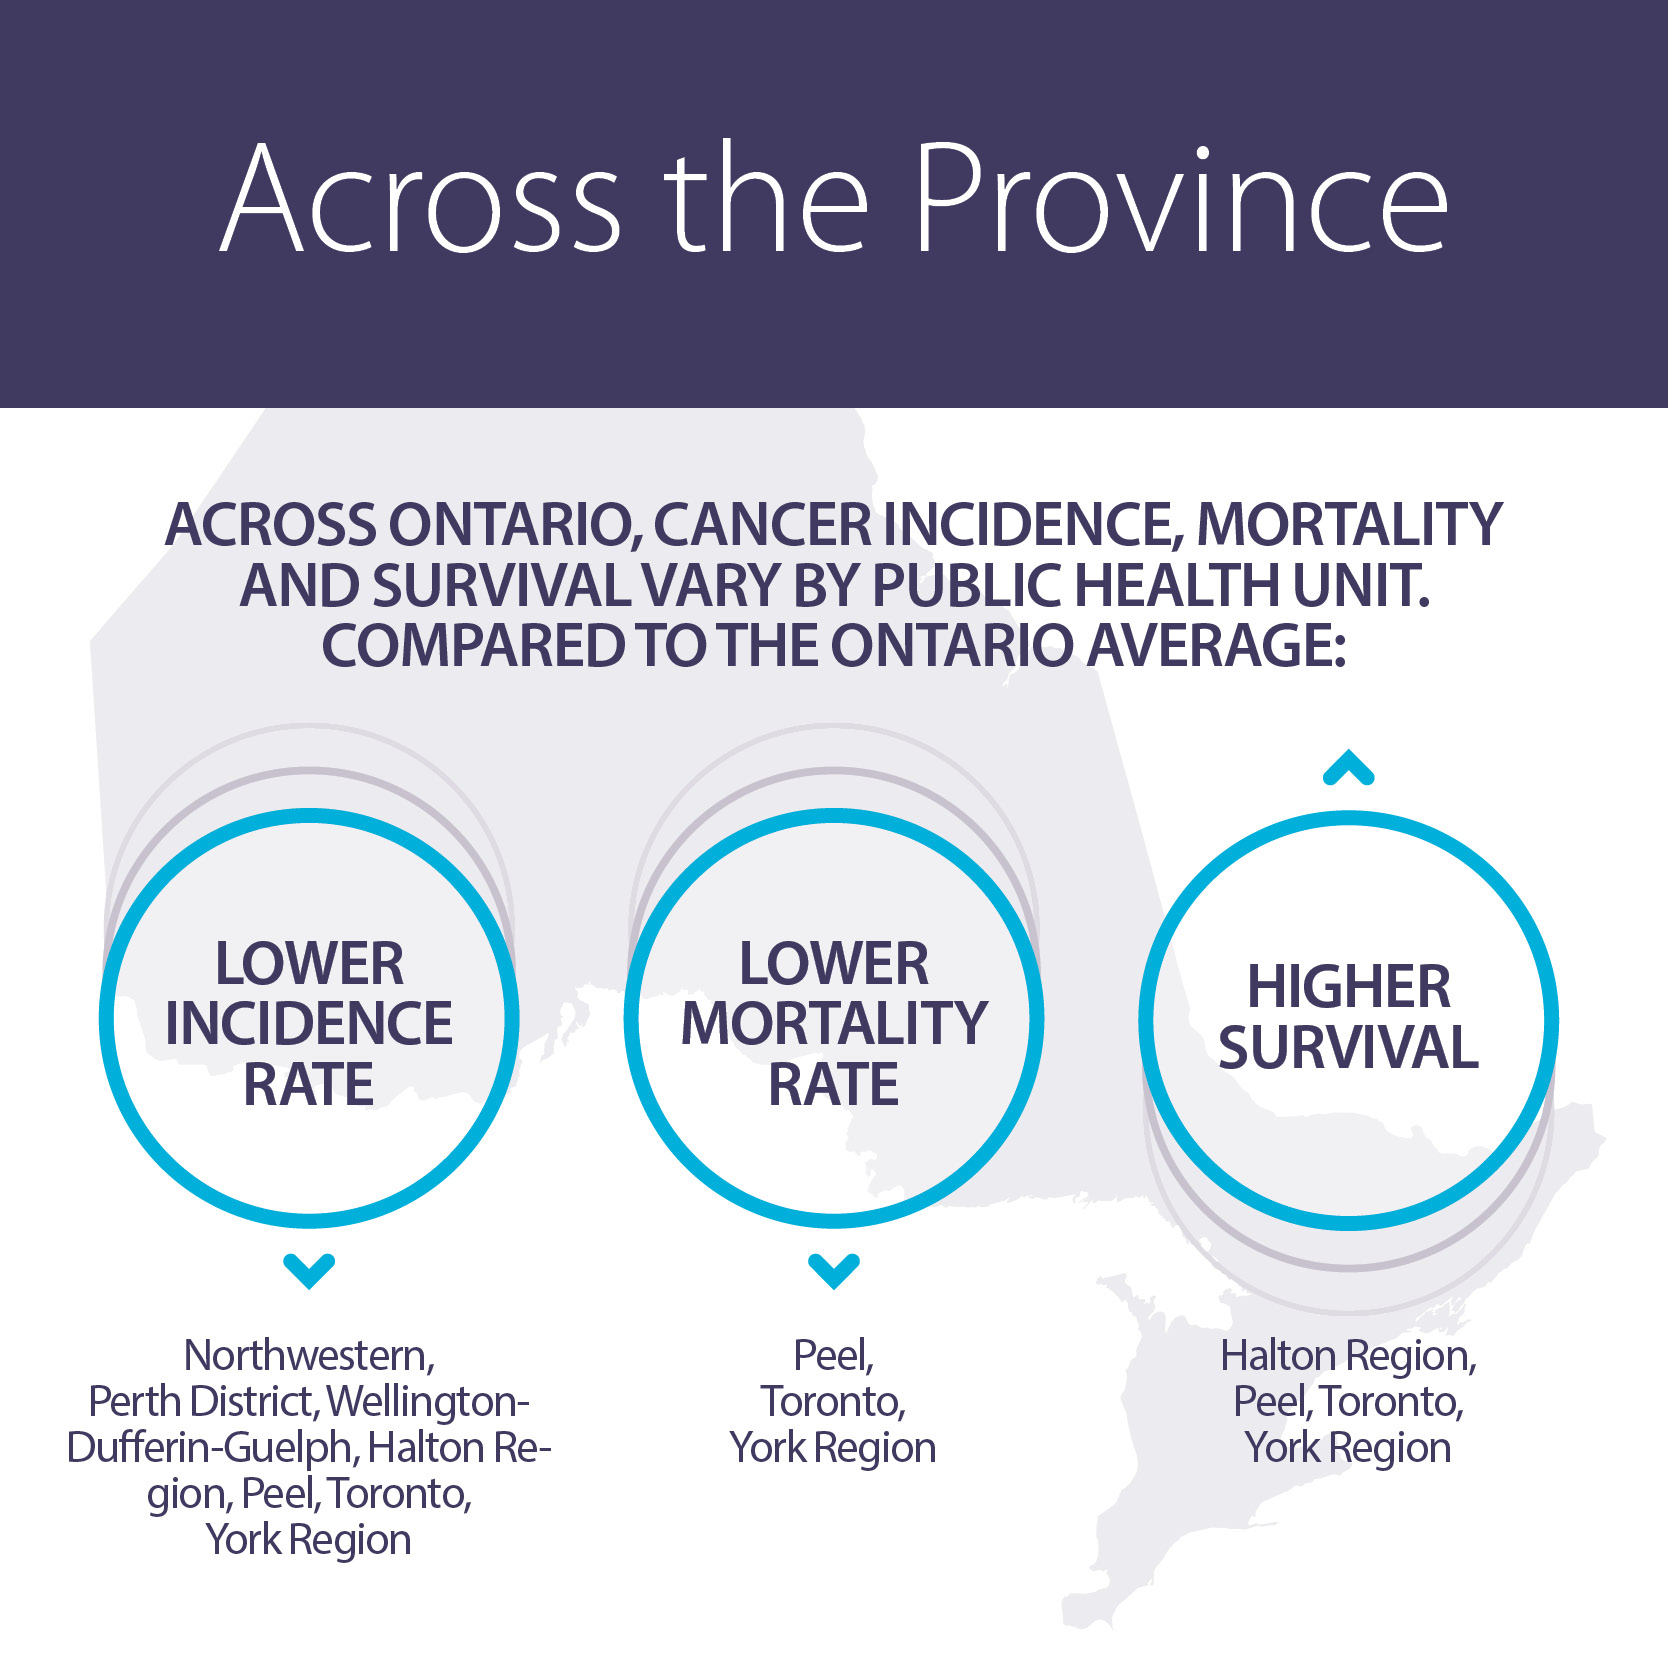
  • Cancer incidence, mortality and survival statistics mapped out by public health unit and sex.
  • PowerPoint slides pre-populated with figures from the report, and data tables providing all of the data from the figures and tables in the report.

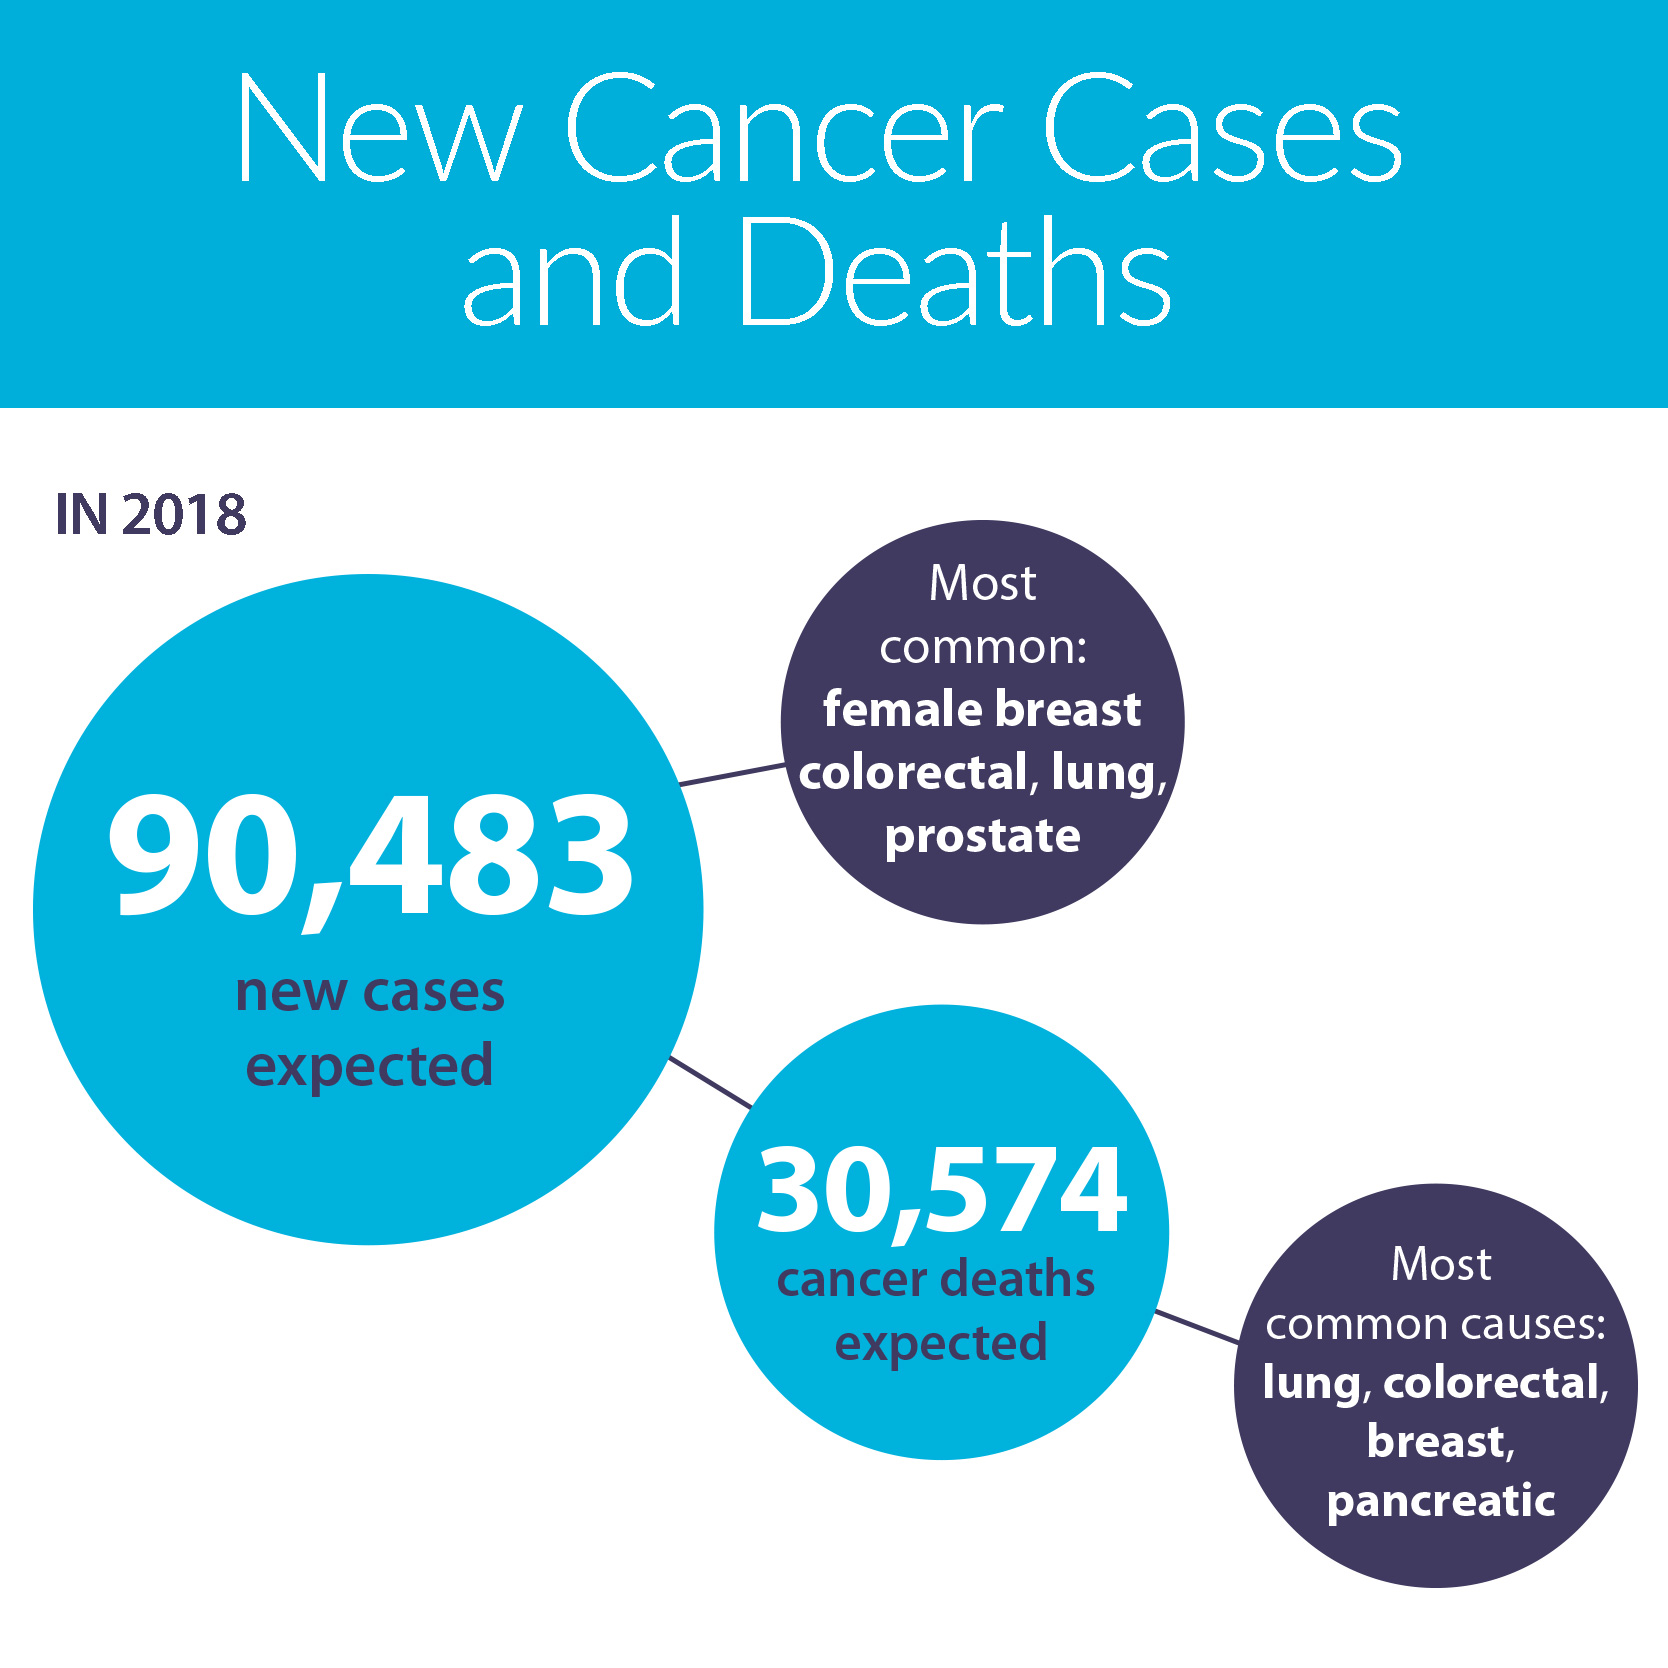
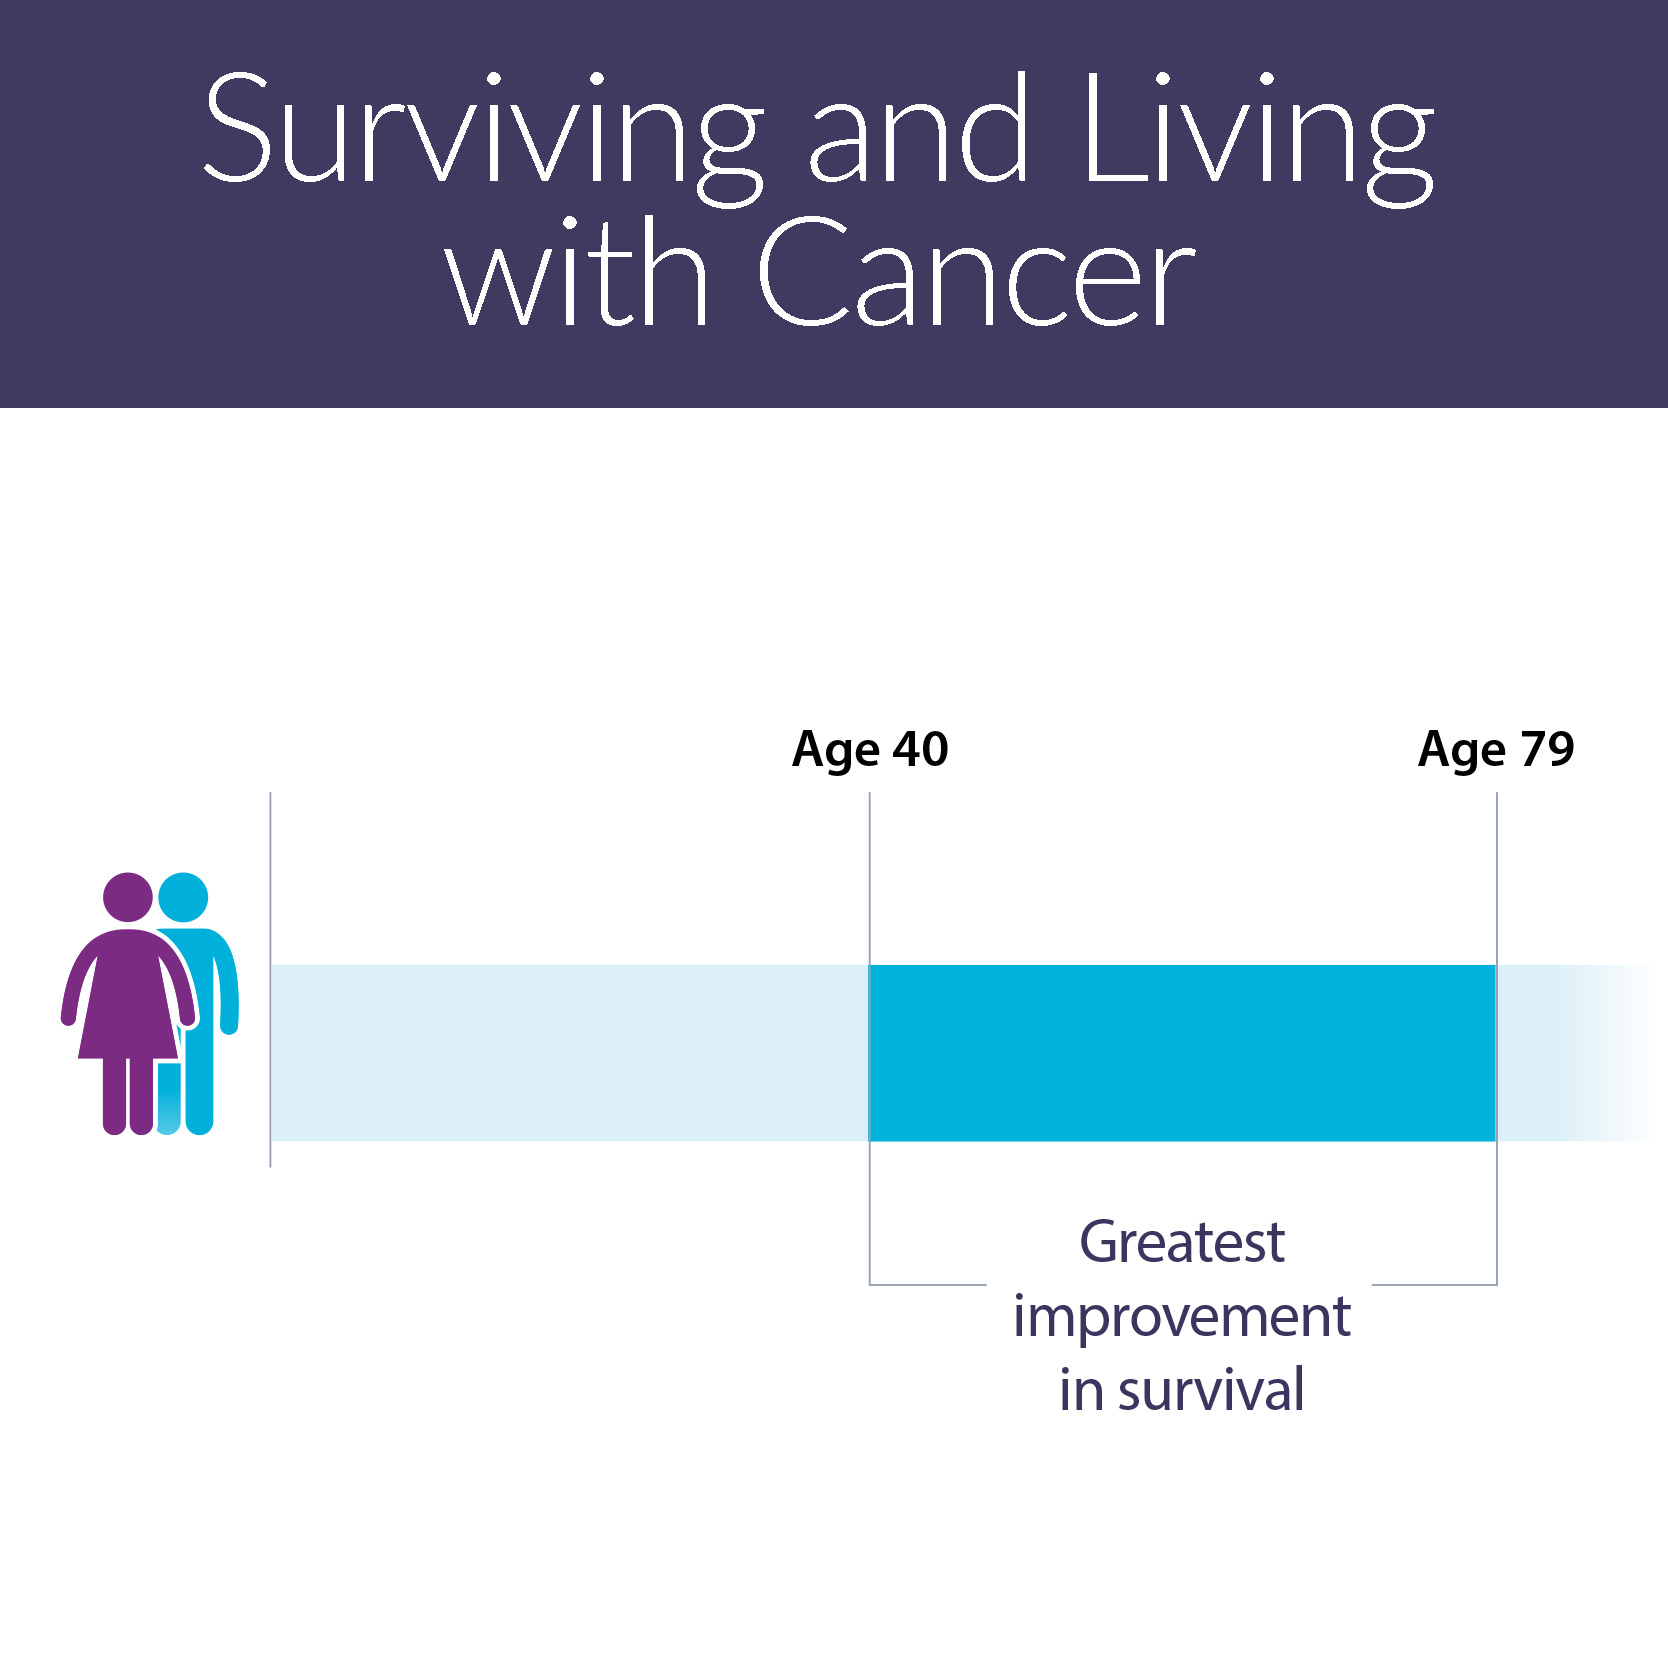
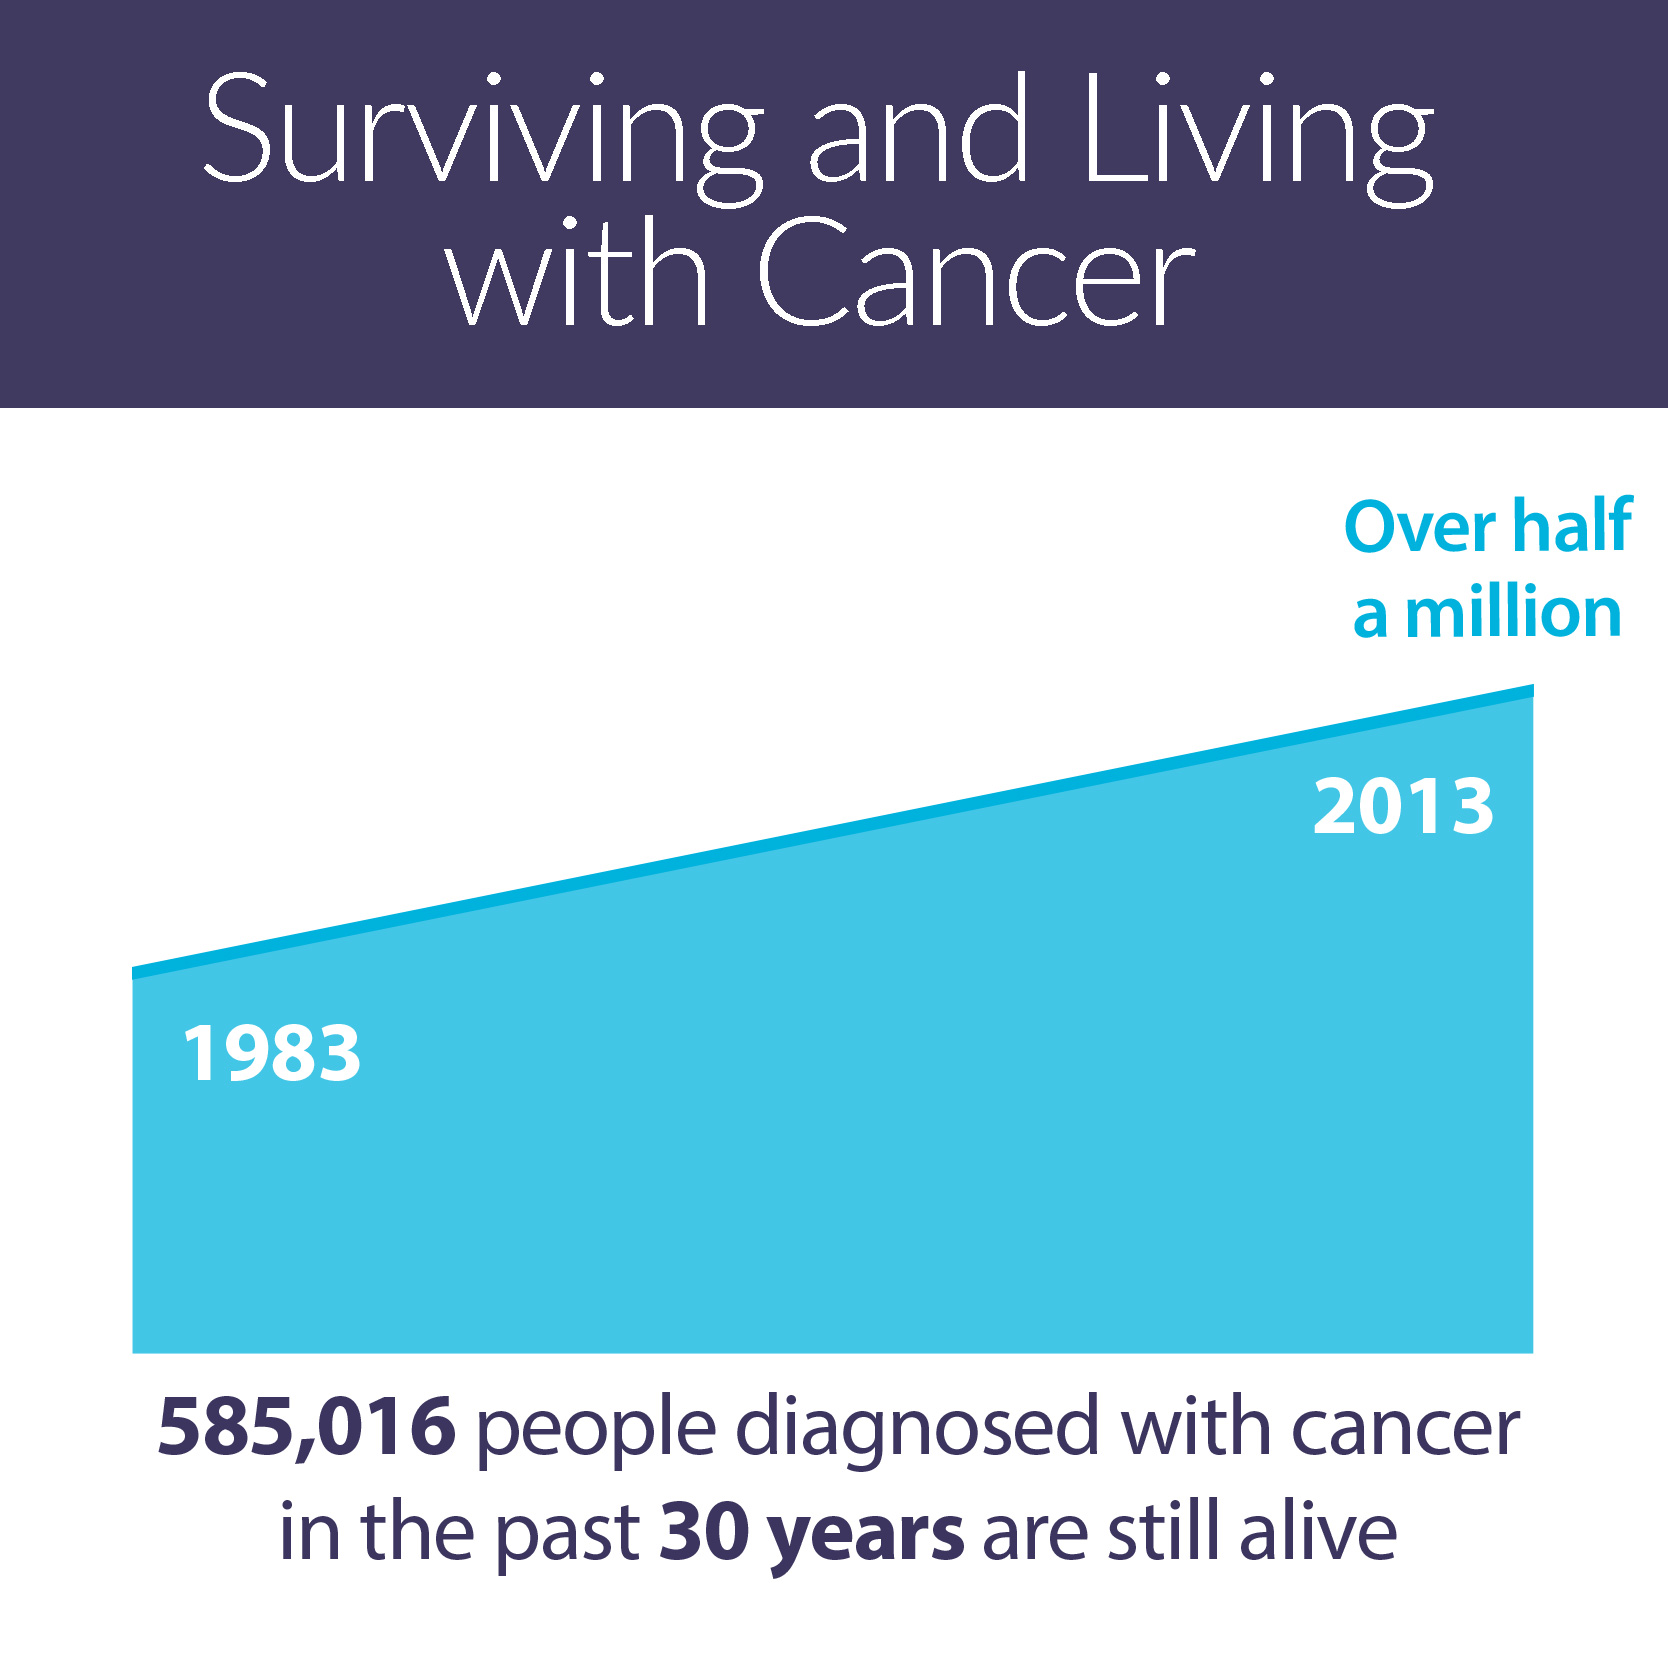
Cancer in Ontario 2018: By the Numbers

Figure Descriptions

Figure 1: Cancer in Ontario

  • 1 in 2 Ontarians are expected to be diagnosed with cancer in their lifetime
  • 1 in 4 Ontarians are expected to die from cancer
  • Cancer is the leading cause of death in Ontario
  • The cancer incidence rate has been stable since 2001 and the mortality rate has been declining since at least 1983

Figure 2: New Cancer Cases and Deaths

In 2018:

  • 90,483 new cases expected

  • Most commonly diagnosed cancers:
    • Female breast followed by colorectal, lung and prostate
  • 30,574 cancer deaths expected
  • Most common causes of cancer death:
    • Lung followed by colorectal, breast and pancreatic

Figure 3: Surviving and Living with Cancer

  • Greatest improvement in survival: people diagnosed at ages 40-79

Figure 4: Surviving and Living with Cancer

  • As of 2013: Over half a million people diagnosed with cancer in Ontario during the last 30 years are still alive

Figure 5: Comorbidities Among Cancer Patients

  • 3 most common comorbidities (among cancer types examined):
    • Diabetes (5-27%)
    • Another primary cancer (2-14%)
    • Chronic obstructive pulmonary disease (COPD) (1-17%)
  • Stage IV: breast, colorectal and lung cancer patients with comorbidity were more likely to be diagnosed at this advanced stage than patients without comorbidity

Figure 6: Wait Time to Cancer Surgery

  • Wait times for cancer surgery in Ontario are assigned based on urgency
  • Longer wait times were not associated with decreased survival, suggesting appropriate wait time assignment

For the cancer types examined and excluding the most urgent cases

Figure 7: Across the Province

  • Across Ontario, cancer incidence, mortality and survival vary by public health unit
  • Compared to the Ontario average:
    • Lower incidence rate:
      Northwestern, Perth District, Wellington-Dufferin-Guelph, Halton Region, Peel, Toronto, York Region
    • Lower mortality rate:
      Peel, Toronto, York Region
    • Higher survival:
      Halton Region, Peel, Toronto, York Region