
Ontario Cancer Statistics 2020 Ch 8: Cancer Prevalence
Cancer prevalence measures the number of people diagnosed with cancer who are still alive. This chapter presents prevalence counts for people diagnosed with cancer within a specific timeframe who were still alive on January 1, 2017.
What's on this page
There are more people living with a diagnosis of cancer in Ontario than there were 20 years ago. Cancer prevalence — the number of people previously diagnosed with cancer who are alive at a given point in time — is a function of the incidence[*] of and survival[*] from cancer. With increasing incidence and improving survival, the prevalence of cancer over time has also been increasing in Ontario, a province with an estimated population of 14.5 million in 2019.
Because trends in cancer prevalence reflect the increase, decrease or stability of cancer incidence and mortality rates in the population, they can help determine how best to distribute diagnostic, treatment and care resources.[1]
This chapter presents limited-duration, person-based prevalence counts. “Limited-duration” cancer prevalence describes the number of people alive on a certain date (called the index date) who were diagnosed with cancer within a specified previous number of years (e.g., 2 years, 5 years, 10 years, 30 years). This report uses an index date (i.e., a reference date) of January 1, 2017. “Person-based” prevalence counts mean that an individual with cancer is counted only once in this measure, even if they have had more than 1 cancer diagnosis.
Prevalence counts based on duration are important for understanding the impacts to the healthcare system. In the first 2 years after their diagnosis, the main healthcare services a person would use are for primary treatment. During the next 3 years, healthcare services mainly consist of clinical assessment to see if the cancer has returned. In the next 5 years, they would mainly use follow-up services. People living with cancer (prevalent cases) whose cancer diagnosis occurred in the previous 10 or more years are long-term survivors. Their cancer experiences are often important for understanding the long-term (or late) effects of a cancer diagnosis and the associated use of healthcare services. A 30-year period provides reasonable time window for accounting for all past and current survivors.
Prevalence by Sex and Cancer Type
At the index date of January 1, 2017, an estimated 393,785 people living in Ontario had been diagnosed with cancer in the previous 10 years (since 2006) (Table 8.1).
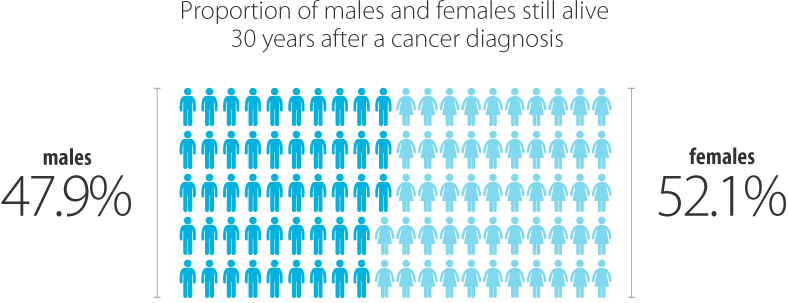
Looking back at those diagnosed in the previous 30 years (since 1986), 638,087 people were still alive at the beginning of 2017. Of these Ontarians, 52.1% diagnosed in the previous 10 years and 53.7% diagnosed in the previous 30 years were female, even though cancer incidence rates were higher among males (see Chapter 1: Estimated Current Cancer Incidence in Ontario and Chapter 5: Cancer Incidence Rates and Trends). This largely reflects the higher prevalence of thyroid and lung cancers in female survivors, because females have a higher incidence of thyroid cancer and higher survival from lung cancer than males.
| Cancer type | Both sexes | Males | Females | |||
|---|---|---|---|---|---|---|
| 10-year | 30-year | 10-year | 30-year | 10-year | 30-year | |
| All cancers | 393,785 | 638,087 | 188,437 | 295,635 | 205,348 | 342,452 |
| Brain and nervous system | ||||||
| Brain and other nervous system - malignant | 3,512 | 6,831 | 1,913 | 3,599 | 1,599 | 3,232 |
| Glioblastoma | 759 | 925 | 419 | 509 | 340 | 416 |
| Meninges - malignant | 101 | 301 | 48 | 118 | 53 | 183 |
| Brain and other nervous system - non-malignant† | 12,734 | 12,734 | 5,186 | 5,186 | 7,548 | 7,548 |
| Meninges - non-malignant† | 5,284 | 5,284 | 1,579 | 1,579 | 3,705 | 3,705 |
| Pituitary, pineal and craniopharyngeal duct† | 3,291 | 3,291 | 1,595 | 1,595 | 1,696 | 1,696 |
| Breast and genital system | ||||||
| Breast (female) | 74,689 | 133,813 | n/a | n/a | 74,689 | 133,813 |
| Cervix | 4,153 | 10,103 | n/a | n/a | 4,153 | 10,103 |
| Ovary | 5,636 | 9,760 | n/a | n/a | 5,636 | 9,760 |
| Prostate | 72,289 | 119,108 | 72,289 | 119,108 | n/a | n/a |
| Testis | 3,649 | 8,684 | 3,649 | 8,684 | n/a | n/a |
| Uterine | 18,078 | 29,815 | n/a | n/a | 18,078 | 29,815 |
| Uterus - endometrial | 17,078 | 27,510 | n/a | n/a | 17,078 | 27,510 |
| Uterus - uterine sarcoma | 394 | 764 | n/a | n/a | 394 | 764 |
| Digestive system | ||||||
| Colorectal | 45,643 | 72,673 | 24,942 | 38,724 | 20,701 | 33,949 |
| Colon excluding rectum | 30,511 | 48,475 | 15,793 | 24,398 | 14,718 | 24,077 |
| Colon - left sided | 12,792 | 21,070 | 7,348 | 11,573 | 5,444 | 9,497 |
| Colon - right sided | 16,936 | 25,476 | 8,018 | 11,802 | 8,918 | 13,674 |
| Rectum and rectosigmoid junction | 16,036 | 25,433 | 9,720 | 15,065 | 6,316 | 10,368 |
| Rectosigmoid junction | 4,229 | 7,283 | 2,531 | 4,190 | 1,698 | 3,093 |
| Rectum | 11,808 | 18,151 | 7,190 | 10,876 | 4,618 | 7,275 |
| Esophagus | 1,636 | 2,111 | 1,234 | 1,537 | 402 | 574 |
| Esophagus - adenocarcinoma | 1,045 | 1,252 | 876 | 1,047 | 169 | 205 |
| Esophagus - squamous cell carcinoma | 480 | 669 | 283 | 369 | 197 | 300 |
| Liver | 2,786 | 3,560 | 2,002 | 2,565 | 784 | 995 |
| Pancreas | 2,627 | 3,342 | 1,372 | 1,685 | 1,255 | 1,657 |
| Stomach | 4,471 | 6,543 | 2,752 | 3,944 | 1,719 | 2,599 |
| Head and neck | ||||||
| Larynx | 2,296 | 3,934 | 1,956 | 3,300 | 340 | 634 |
| Oral cavity and pharynx | 8,849 | 13,900 | 6,170 | 9,507 | 2,679 | 4,393 |
| Lip and oral cavity | 4,322 | 7,184 | 2,672 | 4,516 | 1,650 | 2,668 |
| Hypopharynx | 304 | 407 | 247 | 321 | 57 | 86 |
| Nasopharynx | 711 | 1,372 | 480 | 918 | 231 | 454 |
| Oropharynx | 3,319 | 4,544 | 2,633 | 3,512 | 686 | 1,032 |
| Thyroid | 26,649 | 42,491 | 5,949 | 8,951 | 20,700 | 33,540 |
| Thyroid - anaplastic | 15 | 27 | ** | 7 | 10 | 20 |
| Thyroid - follicular | 844 | 1,978 | 217 | 447 | 627 | 1,531 |
| Thyroid - medullary | 302 | 554 | 128 | 217 | 174 | 337 |
| Thyroid - papillary | 24,966 | 38,173 | 5,488 | 7,926 | 19,478 | 30,247 |
| Hematological | ||||||
| Leukemia | 12,274 | 19,388 | 7,126 | 11,085 | 5,148 | 8,303 |
| Acute lymphocytic leukemia | 1,471 | 3,170 | 847 | 1,807 | 624 | 1,363 |
| Acute monocytic leukemia | 104 | 159 | 52 | 81 | 52 | 78 |
| Acute myeloid leukemia | 1,438 | 2,345 | 744 | 1,181 | 694 | 1,164 |
| Chronic lymphocytic leukemia | 6,349 | 9,063 | 3,802 | 5,311 | 2,547 | 3,752 |
| Chronic myeloid leukemia | 1,647 | 2,518 | 910 | 1,399 | 737 | 1,119 |
| Lymphoma | 24,769 | 39,962 | 13,429 | 21,157 | 11,340 | 18,805 |
| Hodgkin lymphoma | 3,134 | 7,530 | 1,669 | 3,935 | 1,465 | 3,595 |
| Non-Hodgkin lymphoma | 21,672 | 32,492 | 11,782 | 17,256 | 9,890 | 15,236 |
| Non-Hodgkin lymphoma - extranodal | 9,237 | 10,691 | 5,081 | 5,816 | 4,156 | 4,875 |
| Non-Hodgkin lymphoma - nodal | 12,450 | 21,822 | 6,713 | 11,457 | 5,737 | 10,365 |
| Myeloma | 5,234 | 6,451 | 2,885 | 3,519 | 2,349 | 2,932 |
| Melanoma | ||||||
| Melanoma of the skin | 22,347 | 38,601 | 11,624 | 19,009 | 10,723 | 19,592 |
| Melanoma (non-cutaneous) | 906 | 1,599 | 442 | 787 | 464 | 812 |
| Melanoma - mucosal | 143 | 183 | 42 | 46 | 101 | 137 |
| Melanoma - ocular | 764 | 1,417 | 400 | 741 | 364 | 676 |
| Thoracic system | ||||||
| Lung | 21,157 | 27,600 | 9,332 | 12,432 | 11,825 | 15,168 |
| Lung - adenocarcinoma | 11,218 | 13,728 | 4,273 | 5,226 | 6,945 | 8,502 |
| Lung - large cell | 335 | 544 | 158 | 268 | 177 | 276 |
| Lung - small cell | 1,291 | 1,596 | 592 | 740 | 699 | 856 |
| Lung - squamous cell | 4,082 | 5,298 | 2,434 | 3,231 | 1,648 | 2,067 |
| Urinary system | ||||||
| Bladder | 10,987 | 18,728 | 8,572 | 14,243 | 2,415 | 4,485 |
| Kidney | 13,443 | 20,538 | 8,469 | 12,481 | 4,974 | 8,057 |
Symbols:
- ** Suppressed due to small case count (count less than 6).
- †Based on SEER, only reflects 7-year prevalence (2010 to 2016).
Notes:
- Prevalence counts are based on incidence using IARC/IACR rules for counting multiple primaries.
- Only the first cancer of a given type in an individual is counted (for people who have multiple episodes of cancer).
- Counts for cancer sub-sites may not sum to total because not all sub-sites are included.
Analysis by: Surveillance, Analytics and Informatics, Ontario Health (Cancer Care Ontario)
Data source: Ontario Cancer Registry (December 2018), Ontario Health (Cancer Care Ontario)
An estimated 393,785 people living in Ontario had been diagnosed with cancer in the previous 10 years.
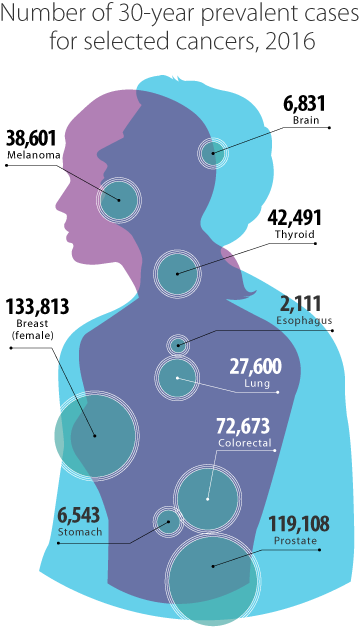
Female breast cancer was the largest contributor to 30-year prevalence, accounting for 133,813 survivors at the end of 2016 (Figure 8.1). Prostate (119,108) and colorectal (72,673) cancers were the next most prevalent types. Lung cancer, despite being the third most commonly diagnosed cancer, ranked only eighth in terms of prevalence because of its low survival. It was surpassed by these higher-survival cancers despite their lower annual incidence: thyroid cancer, lymphoma, melanoma and uterine cancer.
Prevalence Trends by Cancer Type
The increase over time in 10-year prevalence for the most common cancers and all cancers combined is shown in Figure 8.2. The rate of increase in prevalence varies greatly by cancer type. The highest increases are for prostate and female breast cancers, which have higher survival, while the lowest are for colorectal and lung cancers.
Overall, the prevalence of all cancer types except laryngeal increased each decade between 1996, 2006 and 2016 (Table 8.2). However, prevalence for a few cancers was relatively stable in either males or females.
Among females, prevalence of cervical and bladder cancers changed very little over the 3 periods, but for different reasons. For bladder cancer, incidence has increased while survival has decreased. For cervical cancer, survival has changed little over time (see Chapter 7: Cancer Survival).
Among males, the prevalence of laryngeal, lip and oral cavity, and squamous cell carcinoma of the lung was relatively stable.
| Cancer type | Both sexes | Males | Females | ||||||
|---|---|---|---|---|---|---|---|---|---|
| 1996 | 2006 | 2016 | 1996 | 2006 | 2016 | 1996 | 2006 | 2016 | |
| All Cancers | 205,062 | 300,044 | 393,785 | 97,264 | 148,732 | 188,437 | 107,798 | 151,312 | 205,348 |
| Brain and nervous system | |||||||||
| Brain and other nervous system - malignant | 2,663 | 3,322 | 3,512 | 1,418 | 1,741 | 1,913 | 1,245 | 1,581 | 1,599 |
| Glioblastoma | 298 | 451 | 759 | 180 | 267 | 419 | 118 | 184 | 340 |
| Meninges - malignant | 197 | 185 | 101 | 75 | 72 | 48 | 122 | 113 | 53 |
| Brain and other nervous system - non-malignant† | n/a | n/a | 12,734 | n/a | n/a | 5,186 | n/a | n/a | 7,548 |
| Meninges - non-malignant† | n/a | n/a | 5,284 | n/a | n/a | 1,579 | n/a | n/a | 3,705 |
| Pituitary, pineal and craniopharyngeal duct† | n/a | n/a | 3,291 | n/a | n/a | 1,595 | n/a | n/a | 1,696 |
| Breast and genital system | |||||||||
| Breast (female) | 42,321 | 59,090 | 74,689 | n/a | n/a | n/a | 42,321 | 59,090 | 74,689 |
| Cervix | 4,047 | 3,913 | 4,153 | n/a | n/a | n/a | 4,047 | 3,913 | 4,153 |
| Ovary | 3,367 | 4,661 | 5,636 | n/a | n/a | n/a | 3,367 | 4,661 | 5,636 |
| Prostate | 32,582 | 63,527 | 72,289 | 32,582 | 63,527 | 72,289 | n/a | n/a | n/a |
| Testis | 2,438 | 3,045 | 3,649 | 2,438 | 3,045 | 3,649 | n/a | n/a | n/a |
| Uterine | 8,334 | 11,111 | 18,078 | n/a | n/a | n/a | 8,334 | 11,111 | 18,078 |
| Uterus - endometrial | 7,420 | 9,966 | 17,078 | n/a | n/a | n/a | 7,420 | 9,966 | 17,078 |
| Uterus - uterine sarcoma | 238 | 328 | 394 | n/a | n/a | n/a | 238 | 328 | 394 |
| Digestive system | |||||||||
| Colorectal | 26,404 | 36,884 | 45,643 | 13,529 | 19,606 | 24,942 | 12,875 | 17,278 | 20,701 |
| Colon excluding rectum | 18,229 | 24,177 | 30,511 | 8,792 | 11,975 | 15,793 | 9,437 | 12,202 | 14,718 |
| Colon - left sided | 8,038 | 10,304 | 12,792 | 4,246 | 5,667 | 7,348 | 3,792 | 4,637 | 5,444 |
| Colon - right sided | 8,819 | 12,724 | 16,936 | 3,851 | 5,689 | 8,018 | 4,968 | 7,035 | 8,918 |
| Rectum and rectosigmoid junction | 8,315 | 12,946 | 16,036 | 4,815 | 7,776 | 9,720 | 3,500 | 5,170 | 6,316 |
| Rectosigmoid junction | 2,497 | 4,280 | 4,229 | 1,395 | 2,457 | 2,531 | 1,102 | 1,823 | 1,698 |
| Rectum | 5,818 | 8,666 | 11,808 | 3,420 | 5,319 | 7,190 | 2,398 | 3,347 | 4,618 |
| Esophagus | 796 | 1,093 | 1,636 | 522 | 764 | 1,234 | 274 | 329 | 402 |
| Esophagus - adenocarcinoma | 301 | 560 | 1,045 | 252 | 468 | 876 | 49 | 92 | 169 |
| Esophagus - squamous cell carcinoma | 411 | 412 | 480 | 231 | 217 | 283 | 180 | 195 | 197 |
| Liver | 484 | 1,344 | 2,786 | 331 | 984 | 2,002 | 153 | 360 | 784 |
| Pancreas | 990 | 1,493 | 2,627 | 458 | 745 | 1,372 | 532 | 748 | 1,255 |
| Stomach | 2,369 | 3,028 | 4,471 | 1,445 | 1,859 | 2,752 | 924 | 1,169 | 1,719 |
| Head and neck | |||||||||
| Larynx | 2,371 | 2,299 | 2,296 | 1,951 | 1,911 | 1,956 | 420 | 388 | 340 |
| Oral cavity and pharynx | 5,591 | 6,243 | 8,849 | 3,807 | 4,204 | 6,170 | 1,784 | 2,039 | 2,679 |
| Lip and oral cavity | 3,500 | 3,249 | 4,322 | 2,420 | 2,060 | 2,672 | 1,080 | 1,189 | 1,650 |
| Hypopharynx | 251 | 250 | 304 | 194 | 190 | 247 | 57 | 60 | 57 |
| Nasopharynx | 466 | 637 | 711 | 308 | 427 | 480 | 158 | 210 | 231 |
| Oropharynx | 1,041 | 1,755 | 3,319 | 687 | 1,304 | 2,633 | 354 | 451 | 686 |
| Thyroid | 5,056 | 12,782 | 26,649 | 1,137 | 2,551 | 5,949 | 3,919 | 10,231 | 20,700 |
| Thyroid - anaplastic | 11 | 14 | 15 | ** | ** | ** | 10 | 9 | 10 |
| Thyroid - follicular | 643 | 783 | 844 | 157 | 178 | 217 | 486 | 605 | 627 |
| Thyroid - medullary | 132 | 206 | 302 | 57 | 75 | 128 | 75 | 131 | 174 |
| Thyroid - papillary | 3,810 | 10,792 | 24,966 | 816 | 2,102 | 5,488 | 2,994 | 8,690 | 19,478 |
| Hematological | |||||||||
| Leukemia | 5,802 | 8,533 | 12,274 | 3,296 | 4,961 | 7,126 | 2,506 | 3,572 | 5,148 |
| Acute lymphocytic leukemia | 894 | 1,049 | 1,471 | 498 | 609 | 847 | 396 | 440 | 624 |
| Acute monocytic leukemia | 42 | 57 | 104 | 20 | 33 | 52 | 22 | 24 | 52 |
| Acute myeloid leukemia | 653 | 996 | 1,438 | 317 | 513 | 744 | 336 | 483 | 694 |
| Chronic lymphocytic leukemia | 2,818 | 4,612 | 6,349 | 1,603 | 2,762 | 3,802 | 1,215 | 1,850 | 2,547 |
| Chronic myeloid leukemia | 682 | 964 | 1,647 | 414 | 527 | 910 | 268 | 437 | 737 |
| Lymphoma | 10,678 | 15,866 | 24,769 | 5,586 | 8,256 | 13,429 | 5,092 | 7,610 | 11,340 |
| Hodgkin lymphoma | 2,562 | 2,831 | 3,134 | 1,374 | 1,529 | 1,669 | 1,188 | 1,302 | 1,465 |
| Non-Hodgkin lymphoma | 8,117 | 13,038 | 21,672 | 4,213 | 6,729 | 11,782 | 3,904 | 6,309 | 9,890 |
| Non-Hodgkin lymphoma - extranodal | 565 | 1,719 | 9,237 | 323 | 882 | 5,081 | 242 | 837 | 4,156 |
| Non-Hodgkin lymphoma - nodal | 7,552 | 11,320 | 12,450 | 3,890 | 5,848 | 6,713 | 3,662 | 5,472 | 5,737 |
| Myeloma | 1,902 | 3,057 | 5,234 | 963 | 1,632 | 2,885 | 939 | 1,425 | 2,349 |
| Melanoma | |||||||||
| Melanoma of the skin | 9,846 | 14,331 | 22,347 | 4,813 | 7,232 | 11,624 | 5,033 | 7,099 | 10,723 |
| Melanoma (non-cutaneous) | 520 | 726 | 906 | 245 | 366 | 442 | 275 | 360 | 464 |
| Melanoma - mucosal | 35 | 46 | 143 | ** | ** | 42 | 32 | 43 | 101 |
| Melanoma - ocular | 485 | 680 | 764 | 242 | 363 | 400 | 243 | 317 | 364 |
| Thoracic system | |||||||||
| Lung | 11,858 | 14,553 | 21,157 | 6,821 | 7,108 | 9,332 | 5,037 | 7,445 | 11,825 |
| Lung - adenocarcinoma | 4,122 | 5,645 | 11,218 | 1,956 | 2,275 | 4,273 | 2,166 | 3,370 | 6,945 |
| Lung - large cell | 458 | 413 | 335 | 264 | 200 | 158 | 194 | 213 | 177 |
| Lung - small cell | 895 | 1,000 | 1,291 | 487 | 484 | 592 | 408 | 516 | 699 |
| Lung - squamous cell | 3,304 | 2,982 | 4,082 | 2,381 | 1,932 | 2,434 | 923 | 1,050 | 1,648 |
| Urinary system | |||||||||
| Bladder | 9,767 | 10,583 | 10,987 | 7,291 | 8,000 | 8,572 | 2,476 | 2,583 | 2,415 |
| Kidney | 5,302 | 7,982 | 13,443 | 3,168 | 4,708 | 8,469 | 2,134 | 3,274 | 4,974 |
Symbols:
- †Based on SEER, only reflects 7-year prevalence (2010 to 2016).
- ** Suppressed due to small cell count (count less than 6).
Notes:
- Prevalence counts are based on incidence using IARC/IACR rules for counting multiple primaries.
- Only the first cancer of a given type in an individual is counted (for people who have multiple episodes of cancer).
- Counts for cancer sub-sites may not sum to total because not all sub-sites are included.
Analysis by: Surveillance, Analytics and Informatics, Ontario Health (Cancer Care Ontario)
Data source: Ontario Cancer Registry (December 2018), Ontario Health (Cancer Care Ontario)
Prevalence by Age
The majority (50.7%) of 30-year prevalent cancers in 2016 were among Ontarians between the ages of 60 and 79 at diagnosis, followed by those ages 80 or older (22.4%) (Table 8.3). However, this pattern was different between sexes. Although males had the same pattern as both sexes together, the second-highest prevalence for females was among those ages 40 to 59. This is largely attributed to the higher prevalence of breast, cervical, thyroid, melanoma and ovarian cancers among females in that age group.
Among younger people (ages 0 to 39), females are more likely than males to be living with cancer. Notable patterns in this age group include the higher prevalence compared with older ages for brain cancer, which has higher survival rates at younger ages.
| Cancer type | Both sexes | Males | Females | |||||||||
|---|---|---|---|---|---|---|---|---|---|---|---|---|
| 0 - 39 years | 40 - 59 years | 60 - 79 years | 80 years or older | 0 - 39 years | 40 - 59 years | 60 - 79 years | 80 years or older | 0 - 39 years | 40 - 59 years | 60 - 79 years | 80 years or older | |
| All cancers | 30,653 | 140,981 | 323,670 | 142,783 | 13,504 | 49,711 | 159,435 | 72,985 | 17,149 | 91,270 | 164,235 | 69,798 |
| Bladder | 80 | 1,539 | 9,457 | 7,652 | 49 | 1,174 | 7,295 | 5,725 | 31 | 365 | 2,162 | 1,927 |
| Brain | 2,582 | 2,212 | 1,623 | 414 | 1,418 | 1,184 | 833 | 164 | 1,164 | 1,028 | 790 | 250 |
| Breast (female) | 1,826 | 34,019 | 70,771 | 27,197 | n/a | n/a | n/a | n/a | 1,826 | 34,019 | 70,771 | 27,197 |
| Cervix | 903 | 4,908 | 3,546 | 746 | n/a | n/a | n/a | n/a | 903 | 4,908 | 3,546 | 746 |
| Colorectal | 624 | 9,727 | 36,819 | 25,503 | 337 | 5,184 | 21,031 | 12,172 | 287 | 4,543 | 15,788 | 13,331 |
| Esophagus | 15 | 361 | 1,260 | 475 | 12 | 267 | 960 | 298 | ** | 94 | 300 | 177 |
| Hodgkin lymphoma | 2,609 | 3,378 | 1,277 | 266 | 1,329 | 1,771 | 703 | 132 | 1,280 | 1,607 | 574 | 134 |
| Kidney | 897 | 5,023 | 10,951 | 3,667 | 446 | 3,221 | 6,812 | 2,002 | 451 | 1,802 | 4,139 | 1,665 |
| Larynx | 17 | 506 | 2,353 | 1,058 | 9 | 404 | 1,993 | 894 | 8 | 102 | 360 | 164 |
| Leukemia | 3,778 | 3,584 | 8,288 | 3,738 | 2,118 | 2,047 | 4,996 | 1,924 | 1,660 | 1,537 | 3,292 | 1,814 |
| Liver | 170 | 688 | 2,092 | 610 | 109 | 480 | 1,589 | 387 | 61 | 208 | 503 | 223 |
| Lung | 213 | 3,283 | 16,671 | 7,433 | 95 | 1,314 | 7,391 | 3,632 | 118 | 1,969 | 9,280 | 3,801 |
| Melanoma | 1,976 | 10,812 | 18,072 | 7,741 | 675 | 4,518 | 9,673 | 4,143 | 1,301 | 6,294 | 8,399 | 3,598 |
| Myeloma | 43 | 1,128 | 3,676 | 1,604 | 25 | 619 | 2,056 | 819 | 18 | 509 | 1,620 | 785 |
| Non-Hodgkin lymphoma | 2,055 | 7,646 | 16,140 | 6,651 | 1,242 | 4,289 | 8,634 | 3,091 | 813 | 3,357 | 7,506 | 3,560 |
| Oral cavity & pharynx | 316 | 3,699 | 7,494 | 2,391 | 186 | 2,611 | 5,349 | 1,361 | 130 | 1,088 | 2,145 | 1,030 |
| Ovary | 689 | 3,215 | 4,491 | 1,365 | n/a | n/a | n/a | n/a | 689 | 3,215 | 4,491 | 1,365 |
| Pancreas | 98 | 750 | 1,793 | 701 | 38 | 373 | 945 | 329 | 60 | 377 | 848 | 372 |
| Prostate | 18 | 7,529 | 74,573 | 36,988 | 18 | 7,529 | 74,573 | 36,988 | n/a | n/a | n/a | n/a |
| Stomach | 92 | 1,147 | 3,331 | 1,973 | 34 | 679 | 2,083 | 1,148 | 58 | 468 | 1,248 | 825 |
| Testis | 2,582 | 4,661 | 1,341 | 100 | 2,582 | 4,661 | 1,341 | 100 | n/a | n/a | n/a | n/a |
| Thyroid | 5,257 | 20,064 | 14,771 | 2,399 | 975 | 3,862 | 3,522 | 592 | 4,282 | 16,202 | 11,249 | 1,807 |
| Uterus | 245 | 5,408 | 17,869 | 6,293 | n/a | n/a | n/a | n/a | 245 | 5,408 | 17,869 | 6,293 |
Note: Prevalence counts are based on incidence using IARC/IACR rules for counting multiple primaries.
Analysis by: Surveillance, Analytics and Informatics, Ontario Health (Cancer Care Ontario)
Data source: Ontario Cancer Registry (December 2018), Ontario Health (Cancer Care Ontario)