
Ontario Cancer Statistics 2020 Ch 3: Estimated Future Burden of Cancer
Cancer is a heavy burden on individuals and families, on the healthcare system and on society as a whole. This chapter reports projected cancer incidence and mortality counts and rates from 2020 to 2030.
What's on this page
Future Burden Overview
Estimates of future cancer incidence and mortality can help with health services planning, redistribution of current health resources, policy considerations and development of infrastructure for better cancer control. The growing and aging of Ontario’s population continues to contribute to an increase in cancer incidence and prevalence. This requires forecasting of cancer estimates for effective planning to manage the growing burden of cancer.
Future predictions consider different combinations of potential age-specific, cohort-specific and period-specific trends, and assume that these past trends will continue into the future.
The statistical prediction models used for this report do not consider these changes individually:
- Recent changes in the prevalence of cancer risk factors
- Changes in medical practice
- Advances in diagnostic procedures
- Changes in cancer registration practices
For example, cancer screening can have a strong influence on rates of new cancer diagnoses and, as a result, on future incidence rates. However, projections of future cases will not account for any future implementation of population-level cancer screening programs, as is anticipated for lung cancer. Similarly, other interventions that have been recently implemented, such as school-based HPV vaccination programs for the prevention of cervical cancer, will not strongly influence the projections for the targeted cancer.
Because of their large numbers, projections for the most common cancers tend to have the biggest influence over the total projected number of cases and rates. Therefore, any uncertainty in the projection of these cancers will affect the projection of all cancers combined.
Projected Trends in Cancer Incidence
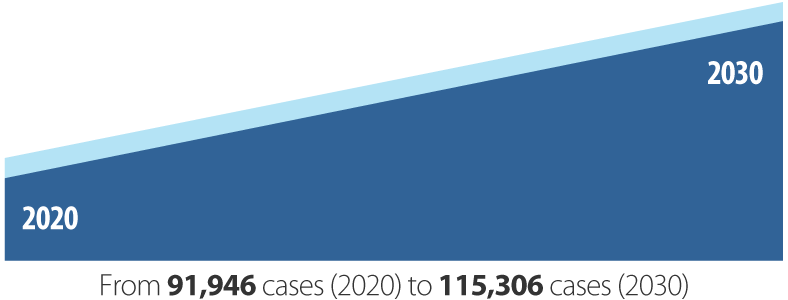
New cancer cases are predicted to increase by 25.4% over the next 10 years, from approximately 91,946 cases in 2020 to 115,306 in 2030 (Figure 3.1). In fact, starting in 2024, over 100,000 new cancer cases are expected to be diagnosed in Ontario every year. The growth in the number of new cases will represent an increase of 0.7% in the incidence rate between 2020 (551.8 per 100,000) and 2030 (555.5 per 100,000) (Figure 3.1).
The number of new cancer cases among males is expected to increase from 46,288 in 2020 to 57,482 by 2030. In females, new cases will grow from 47,738 in 2020 to 60,386 in 2030 (Figure 3.2).
However, the trend in incidence rates in each sex is expected to converge in the future as the male incidence rate declines and the female incidence rate increase over time (Figure 3.2). By 2030, the gap in incidence rates between males and females will have substantially narrowed, suggesting that women will be as likely as men to develop cancer.
By 2030, women will be as likely as men to develop cancer.
The declining male incidence rate will be driven largely by the prostate and lung cancer trends, and to a lesser extent by the colorectal cancer trend (Figure 3.3). The rates of all 3 cancers are expected to decline. The rising female incidence rate is expected to be due to rising trends for uterus, thyroid and liver cancers (see next section, Projected Incidence by Cancer Type).
Projected Incidence by Cancer Type
Table 3.1 shows that projected counts and incidence rates for new cancer cases are expected to differ by cancer type. In both sexes combined, the largest (more than 10%) relative increases in rates between 2020 and 2030 are expected for liver, thyroid, uterine, kidney and pancreatic cancers, and non-Hodgkin lymphoma. The largest (more than 10%) relative decreases in rates are expected for laryngeal, bladder, prostate and lung cancers.
Given these relative changes in rates, by 2030, non-Hodgkin lymphoma, pancreatic and liver cancers are expected to represent a larger percentage of all new cancer cases. In contrast, lung and bladder cancers are expected to represent a smaller percentage of all new cancer cases than in 2020.
Some notable differences in patterns exist between males and females. Specifically, the relative increase in the liver cancer incidence rate is projected to be higher in females than males. In contrast, the relative increases in projected incidence rates for kidney, pancreatic and thyroid cancers are higher in males than females.
The incidence rate projections for 5 of the most common cancers in Ontario – breast, prostate, lung, colorectal and bladder – generally show a direction in trends similar to a recent Canadian study that examined the future burden of cancer, with some exceptions.[1] For example, this report predicts a decreasing trend in prostate and colorectal cancers, while the study predicts an increase in these cancer types, although for a longer period of projection.
In males:
- a substantial decrease in the projected incidence rate for prostate cancer is anticipated, although this trend may change due to the recent softening of recommendations against PSA to screen for prostate cancer in the US[2]
- by 2030, non-Hodgkin lymphoma is expected to surpass bladder cancer as the fourth leading cancer
In females:
- a large increase is expected for liver and uterine cancers in females
- by 2030, the age-standardized incidence rate for 3 of the most common cancers in females – thyroid, uterine, and non-Hodgkin lymphoma – will have increased by over 10%
By 2030, non-Hodgkin lymphoma, pancreatic and liver cancers are expected to represent a larger percentage of all new cancer cases.
| Cancer type | Both sexes | Males | Females | ||||||||||||
|---|---|---|---|---|---|---|---|---|---|---|---|---|---|---|---|
| New cases (2020) | ASIR (2020) | New cases (2030) | ASIR (2030) | % change in ASIR | New cases (2020) | ASIR (2020) | New cases (2030) | ASIR (2030) | % change in ASIR | New cases (2020) | ASIR (2020) | New cases (2030) | ASIR (2030) | % change in ASIR | |
| All cancers | 91,946 | 551.8 | 115,306 | 555.5 | 0.7 | 45,494 | 577.2 | 56,530 | 562.5 | -2.5 | 46,452 | 536.0 | 58,776 | 552.4 | 3.1 |
| Bladder | 4,320 | 24.7 | 4,960 | 20.8 | -15.8 | 3,329 | 41.9 | 3,898 | 35.3 | -15.8 | 991 | 10.5 | 1,062 | 8.4 | -20.0 |
| Brain | 1,214 | 7.7 | 1,383 | 7.4 | -3.9 | 695 | 9.2 | 796 | 8.9 | -3.3 | 519 | 6.3 | 587 | 6.0 | -4.8 |
| Breast (female) | 11,945 | 142.8 | 14,365 | 145.0 | 1.5 | n/a | n/a | n/a | n/a | n/a | 11,945 | 142.8 | 14,365 | 145.0 | 1.5 |
| Cervix | 553 | 7.3 | 571 | 6.8 | -6.8 | n/a | n/a | n/a | n/a | n/a | 553 | 7.3 | 571 | 6.8 | -6.8 |
| Colorectal | 9,245 | 54.4 | 11,184 | 52.1 | -4.2 | 5,047 | 64.1 | 6,129 | 60.7 | -5.3 | 4,198 | 45.9 | 5,055 | 44.3 | -3.5 |
| Esophagus | 984 | 5.8 | 1,280 | 5.8 | 0.0 | 755 | 9.5 | 997 | 9.7 | 2.1 | 229 | 2.4 | 283 | 2.3 | -4.2 |
| Hodgkin lymphoma | 398 | 2.7 | 434 | 2.7 | 0.0 | 209 | 2.9 | 222 | 2.8 | -3.4 | 189 | 2.5 | 212 | 2.6 | 4.0 |
| Kidney | 2,904 | 17.8 | 3,961 | 20.0 | 12.4 | 1,918 | 24.9 | 2,692 | 28.7 | 15.3 | 986 | 11.3 | 1,269 | 12.0 | 6.2 |
| Larynx | 402 | 2.4 | 399 | 1.8 | -25.0 | 342 | 4.3 | 340 | 3.3 | -23.3 | 60 | 0.7 | 59 | 0.5 | -28.6 |
| Leukemia | 2,796 | 16.8 | 3,517 | 16.8 | 0.0 | 1,621 | 20.9 | 2,032 | 20.4 | -2.4 | 1,175 | 13.3 | 1,485 | 13.6 | 2.3 |
| Liver | 1,802 | 10.5 | 2,714 | 12.0 | 14.3 | 1,181 | 14.7 | 1,659 | 15.5 | 5.4 | 621 | 6.8 | 1,055 | 8.8 | 29.4 |
| Lung | 10,592 | 60.8 | 12,235 | 53.0 | -12.8 | 5,127 | 64.0 | 5,838 | 54.2 | -15.3 | 5,465 | 58.5 | 6,397 | 51.9 | -11.3 |
| Melanoma | 4,364 | 26.4 | 5,601 | 26.3 | -0.4 | 2,539 | 32.8 | 3,350 | 32.5 | -0.9 | 1,825 | 21.5 | 2,251 | 21.3 | -0.9 |
| Myeloma | 1,526 | 8.9 | 2,096 | 9.3 | 4.5 | 877 | 11.1 | 1,228 | 11.7 | 5.4 | 649 | 7.0 | 868 | 7.3 | 4.3 |
| Non-Hodgkin lymphoma | 5,490 | 33.0 | 7,805 | 36.8 | 11.5 | 3,154 | 40.7 | 4,579 | 45.6 | 12.0 | 2,336 | 26.3 | 3,226 | 29.0 | 10.3 |
| Oral cavity & pharynx | 2,067 | 12.7 | 2,667 | 13.5 | 6.3 | 1,506 | 19.5 | 1,973 | 21.2 | 8.7 | 561 | 6.4 | 694 | 6.3 | -1.6 |
| Ovary | 1,277 | 15.2 | 1,454 | 14.6 | -3.9 | n/a | n/a | n/a | n/a | n/a | 1,277 | 15.2 | 1,454 | 14.6 | -3.9 |
| Pancreas | 2,533 | 14.7 | 3,696 | 16.5 | 12.2 | 1,352 | 17.1 | 2,046 | 19.7 | 15.2 | 1,181 | 12.6 | 1,650 | 13.5 | 7.1 |
| Prostate | 8,528 | 103.8 | 9,392 | 89.8 | -13.5 | 8,528 | 103.8 | 9,392 | 89.8 | -13.5 | n/a | n/a | n/a | n/a | n/a |
| Stomach | 1,826 | 10.8 | 2,492 | 11.6 | 7.4 | 1,161 | 14.8 | 1,584 | 15.6 | 5.4 | 665 | 7.4 | 908 | 8.1 | 9.5 |
| Testis | 490 | 7.0 | 559 | 7.6 | 8.6 | 490 | 7.0 | 559 | 7.6 | 8.6 | n/a | n/a | n/a | n/a | n/a |
| Thyroid | 4,109 | 27.6 | 5,369 | 31.5 | 14.1 | 1,118 | 15.1 | 1,608 | 18.7 | 23.8 | 2,991 | 39.6 | 3,761 | 43.8 | 10.6 |
| Uterus | 3,355 | 39.4 | 4,494 | 45.0 | 14.2 | n/a | n/a | n/a | n/a | n/a | 3,355 | 39.4 | 4,494 | 45.0 | 14.2 |
Abbreviations:
- ASIR means age-standardized incidence rate.
- N/a means not applicable.
Notes:
- Rates are per 100,000 and standardized to the age distribution of the 2011 Canadian population.
- Projected incidence rates are based on the NCI SEER standards for counting multiple primary cancers, which were adopted by the Ontario Cancer Registry for cases diagnosed in 2010 and beyond.
- Projections are based on malignant cases only (excluding non-melanoma skin cancer).
Analysis by: Surveillance, Analytics and Informatics, Ontario Health (Cancer Care Ontario)
Data source: Ontario Cancer Registry (December 2018), Ontario Health (Cancer Care Ontario)
Projected Incidence by Age
The anticipated change in incidence counts and rates will also vary by age group between 2020 and 2030.
Ages 0 to 39 years:
- The largest relative increases (more than 10%) in incidence rate are expected for pancreatic, non-Hodgkin lymphoma, leukemia, breast, oral cavity and pharynx, and uterine cancers (Table 3.2).
- The largest (more than 10%) relative decreases in rates are expected for bladder, cervical and lung cancers, and melanoma.
| Cancer type | Ages 0 - 39 years | Ages 40 - 59 years | Ages 60 - 79 years | Ages 80 years or older | ||||||||||||||||
|---|---|---|---|---|---|---|---|---|---|---|---|---|---|---|---|---|---|---|---|---|
| New cases (2020) | Age-specific rate (2020) | New cases (2030) | Age-specific rate (2030) | % change in age-specific rate | New cases (2020) | Age-specific rate (2020) | New cases (2030) | Age-specific rate (2030) | % change in age-specific rate | New cases (2020) | Age-specific rate (2020) | New cases (2030) | Age-specific rate (2030) | % change in age-specific rate | New cases (2020) | Age-specific rate (2020) | New cases (2030) | Age-specific rate (2030) | % change in age-specific rate | |
| All cancers | 4,379 | 62.6 | 4,970 | 67.1 | 7.2 | 20,215 | 516.6 | 20,538 | 514.7 | -0.4 | 50,120 | 1,699.1 | 64,046 | 1748.6 | 2.9 | 17,232 | 2501.4 | 25,752 | 2,394.6 | -4.3 |
| Bladder | 30 | 0.4 | 19 | 0.3 | -25.0 | 480 | 12.3 | 371 | 9.3 | -24.4 | 2,509 | 85.1 | 2,775 | 75.8 | -10.9 | 1,301 | 188.9 | 1,795 | 166.9 | -11.6 |
| Brain | 241 | 3.4 | 258 | 3.5 | 2.9 | 311 | 7.9 | 300 | 7.5 | -5.1 | 519 | 17.6 | 620 | 16.9 | -4.0 | 143 | 20.8 | 205 | 19.1 | -8.2 |
| Breast (female) | 541 | 15.6 | 649 | 17.8 | 14.1 | 3,997 | 201.1 | 4,188 | 204.2 | 1.5 | 5,826 | 378.4 | 7,052 | 371.7 | -1.8 | 1,581 | 385.4 | 2,476 | 403.3 | 4.6 |
| Cervix | 142 | 4.1 | 127 | 3.5 | -14.6 | 239 | 12.0 | 243 | 11.8 | -1.7 | 144 | 9.4 | 165 | 8.7 | -7.4 | 28 | 6.8 | 36 | 5.9 | -13.2 |
| Colorectal | 194 | 2.8 | 258 | 3.5 | 25.0 | 1,713 | 43.8 | 1,630 | 40.8 | -6.8 | 4,250 | 144.1 | 4,074 | 111.2 | -22.8 | 2,302 | 334.2 | 2,981 | 277.2 | -17.1 |
| Esophagus | 7 | 0.1 | 8 | 0.1 | 0.0 | 180 | 4.6 | 168 | 4.2 | -8.7 | 580 | 19.7 | 759 | 20.7 | 5.1 | 217 | 31.5 | 345 | 32.1 | 1.9 |
| Hodgkin lymphoma | 207 | 3.0 | 214 | 2.9 | -3.3 | 87 | 2.2 | 88 | 2.2 | 0.0 | 83 | 2.8 | 101 | 2.8 | 0.0 | 21 | 3.0 | 31 | 2.9 | -3.3 |
| Kidney | 110 | 1.6 | 126 | 1.7 | 6.2 | 835 | 21.3 | 933 | 23.4 | 9.9 | 1,537 | 52.1 | 2,173 | 59.3 | 13.8 | 422 | 61.3 | 729 | 67.8 | 10.6 |
| Larynx | ** | ** | ** | ** | ** | 72 | 1.8 | 57 | 1.4 | -22.2 | 258 | 8.7 | 255 | 7.0 | -19.5 | 68 | 9.9 | 83 | 7.7 | -22.2 |
| Leukemia | 314 | 4.5 | 384 | 5.2 | 15.6 | 481 | 12.3 | 478 | 12.0 | -2.4 | 1,366 | 46.3 | 1,742 | 47.6 | 2.8 | 635 | 92.2 | 913 | 84.9 | -7.9 |
| Liver | 27 | 0.4 | 28 | 0.4 | 0.0 | 301 | 7.7 | 283 | 7.1 | -7.8 | 1,110 | 37.6 | 1,674 | 45.7 | 21.5 | 364 | 52.8 | 729 | 67.8 | 28.4 |
| Lung | 50 | 0.7 | 48 | 0.6 | -14.3 | 1,314 | 33.6 | 1,134 | 28.4 | -15.5 | 6,657 | 225.7 | 7,486 | 204.4 | -9.4 | 2,571 | 373.2 | 3,567 | 331.7 | -11.1 |
| Melanoma | 305 | 4.4 | 287 | 3.9 | -11.4 | 990 | 25.3 | 940 | 23.6 | -6.7 | 2,126 | 72.1 | 2,673 | 73.0 | 1.2 | 943 | 136.9 | 1,701 | 158.2 | 15.6 |
| Myeloma | 12 | 0.2 | 15 | 0.2 | 0.0 | 256 | 6.5 | 258 | 6.5 | 0.0 | 869 | 29.5 | 1,186 | 32.4 | 9.8 | 389 | 56.5 | 637 | 59.2 | 4.8 |
| Non-Hodgkin lymphoma | 351 | 5.0 | 460 | 6.2 | 24.0 | 1,104 | 28.2 | 1,200 | 30.1 | 6.7 | 2,866 | 97.2 | 4,024 | 109.9 | 13.1 | 1,169 | 169.7 | 2,121 | 197.2 | 16.2 |
| Oral cavity & pharynx | 56 | 0.8 | 63 | 0.9 | 12.5 | 621 | 15.9 | 610 | 15.3 | -3.8 | 1,132 | 38.4 | 1,560 | 42.6 | 10.9 | 258 | 37.5 | 434 | 40.4 | 7.7 |
| Ovary | 84 | 2.4 | 80 | 2.2 | -8.3 | 391 | 19.7 | 399 | 19.5 | -1.0 | 604 | 39.2 | 713 | 37.6 | -4.1 | 198 | 48.3 | 262 | 42.7 | -11.6 |
| Pancreas | 35 | 0.5 | 53 | 0.7 | 40.0 | 398 | 10.2 | 432 | 10.8 | 5.9 | 1,410 | 47.8 | 2,032 | 55.5 | 16.1 | 690 | 100.2 | 1,179 | 109.6 | 9.4 |
| Prostate | 0 | 0.0 | 0 | 0.0 | 0.0 | 1,343 | 69.8 | 955 | 49.2 | -29.5 | 6,303 | 447.0 | 7,303 | 413.6 | -7.5 | 882 | 316.5 | 1,134 | 245.7 | -22.4 |
| Stomach | 41 | 0.6 | 45 | 0.6 | 0.0 | 364 | 9.3 | 408 | 10.2 | 9.7 | 974 | 33.0 | 1,361 | 37.2 | 12.7 | 447 | 64.9 | 678 | 63.0 | -2.9 |
| Testis | 335 | 9.5 | 357 | 9.5 | 0.0 | 127 | 6.6 | 158 | 8.1 | 22.7 | 25 | 1.8 | 38 | 2.2 | 22.2 | ** | ** | 6 | 1.3 | ** |
| Thyroid | 757 | 10.8 | 754 | 10.2 | -5.6 | 1,838 | 47.0 | 1,991 | 49.9 | 6.2 | 1,373 | 46.5 | 2,294 | 62.6 | 34.6 | 141 | 20.5 | 330 | 30.7 | 49.8 |
| Uterus | 64 | 1.8 | 74 | 2.0 | 11.1 | 1,054 | 53.0 | 1,172 | 57.1 | 7.7 | 1,908 | 123.9 | 2,625 | 138.4 | 11.7 | 329 | 80.2 | 623 | 101.5 | 26.6 |
Symbol: ** Suppressed due to small case counts (less than 6).
Notes:
- Rates are per 100,000.
- Projected incidence rates are based on the NCI SEER standards for counting multiple primary cancers, which were adopted by the Ontario Cancer Registry for cases diagnosed in 2010 and beyond.
- Projections are based on malignant cases only (excluding non-melanoma skin cancer).
Analysis by: Surveillance, Analytics and Informatics, Ontario Health (Cancer Care Ontario)
Data source: Ontario Cancer Registry (December 2018), Ontario Health (Cancer Care Ontario)
Ages 40 to 59 years:
- The largest projected increase (more than 10%) in incidence rate) will be limited to testicular cancer.
- Decreases of more than 10% will be seen for prostate, bladder, laryngeal and lung cancers.
Differences exist between the under 60 and over 60 age groups in both the types of cancers and the number of cancer types for which changes are expected.
Ages 60 to 79 years (representing the largest proportion of cancers):
- The relative increase in incidence rate is predicted to be highest for thyroid, testicular, liver, pancreatic, kidney, non-Hodgkin lymphoma, stomach, and oral cavity & pharynx cancers. Relative incidence rate decreases are projected to be largest for laryngeal, bladder and lung cancers.
Ages 80 years and older (the oldest age group):
- This group is expected to experience the largest overall decrease in incidence rate between 2020 and 2030.
- As with the 60 to 79 year age group, relative increases in projected incidence rates are greatest for thyroid, liver, uterine and testicular cancers, non-Hodgkin lymphoma and melanoma.
- Relative decreases in the incidence rate are expected to be greatest for prostate, laryngeal, colorectal, cervical, bladder, ovarian and lung cancers.
Population-based cancer screening can have a strong influence on rates of new cancer diagnoses and, consequently, on future incidence rates. These projections do not take into account the expected influence of future population-based screening programs, such as the one anticipated for lung cancer.
Projected Trends in Cancer Mortality
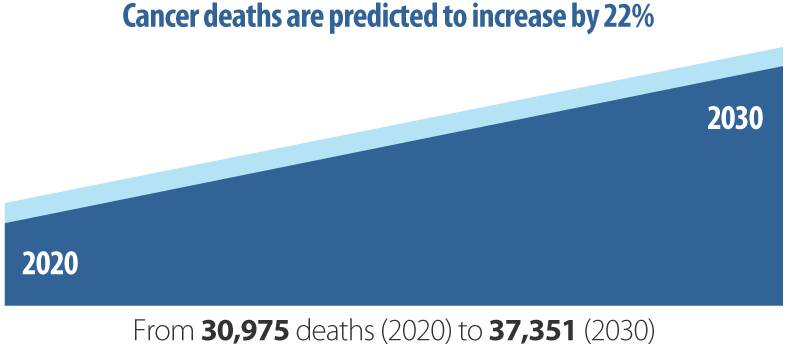
Cancer deaths are predicted to increase by 22% over the next 10 years, from 30,975 deaths in 2020 to 37,351 deaths in 2030 (Figure 3.4).
The rising number of cancer deaths will reflect the increasing incidence. Among males, cancer deaths are expected to increase from 16,066 in 2020 to 19,563 by 2030. In females, the number of cancer deaths will grow from 14,909 in 2020 to 17,788 in 2030 (Figure 3.5).
However, when accounting for the growing population size, the cancer death rate is expected to decrease between 2020 (178.0 per 100,000) and 2030 (159.8 per 100,000). The decrease in overall death rates reflects a continuing decline in both male and female cancer death rates. The mortality rate is expected to decline slightly faster in males than females (Figure 3.5).
The projected declines in mortality rates are expected to be largely driven by lung cancer (Figure 3.6). Smaller declines are also expected for breast and colorectal cancers.
Projected Mortality by Cancer Type
Table 3.3 shows that both the projected number of deaths and the rates are expected to differ by cancer type. In both sexes combined, only liver cancer is expected to have a notable relative increase (of 6.0%) in mortality rate between 2020 and 2030, largely driven by the rate in females. For most cancers examined, the death rate is expected to decrease between 2020 and 2030, with the largest (more than 10%) relative decreases in rates expected for Hodgkin lymphoma, lung cancer, non-Hodgkin lymphoma and laryngeal cancer.
By 2030, lung cancer is expected to represent a smaller percentage of deaths compared with 2020, while liver cancer will represent a slightly higher percentage.
Given these relative changes in rates, by 2030, lung cancer is expected to represent a smaller percentage of deaths compared with 2020, while liver cancer will represent a slightly higher percentage.
Some notable differences in patterns are observed between males and females:
- Males are projected to have higher relative decreases in death rates than females for both colorectal cancer and melanoma.
- Females are expected to have higher relative decreases in death rates than males for kidney and larynx cancers.
- The relative decreases in projected mortality rates for most cancers are similar between the sexes.
- A substantial relative decrease in the projected death rate for cervical cancer is anticipated for females.
| Cancer type | Both sexes | Males | Females | ||||||||||||
|---|---|---|---|---|---|---|---|---|---|---|---|---|---|---|---|
| Deaths (2020) | ASMR (2020) | Deaths (2030) | ASMR (2030) | % change in ASMR | Deaths (2020) | ASMR (2020) | Deaths (2030) | ASMR (2030) | % change in ASMR | Deaths (2020) | ASMR (2020) | Deaths (2030) | ASMR (2030) | % change in ASMR | |
| All cancers | 30,975 | 178.0 | 37,351 | 159.8 | -10.2 | 16,066 | 205.0 | 19,563 | 180.0 | -12.2 | 14,909 | 157.8 | 17,788 | 143.5 | -9.1 |
| Bladder | 982 | 5.5 | 1,364 | 5.3 | -3.6 | 706 | 9.2 | 994 | 8.7 | -5.4 | 276 | 2.7 | 370 | 2.6 | -3.7 |
| Brain | 945 | 5.8 | 1,164 | 5.8 | 0.0 | 521 | 6.8 | 629 | 6.6 | -2.9 | 424 | 4.9 | 535 | 5.1 | 4.1 |
| Breast (female) | 1,980 | 21.9 | 2,183 | 19.6 | -10.5 | n/a | n/a | n/a | n/a | n/a | 1,980 | 21.9 | 2,183 | 19.6 | -10.5 |
| Cervix | 185 | 2.3 | 226 | 2.4 | 4.3 | n/a | n/a | n/a | n/a | n/a | 185 | 2.3 | 226 | 2.4 | 4.3 |
| Colorectal | 3,194 | 18.3 | 3,846 | 16.6 | -9.3 | 1,694 | 21.8 | 2,083 | 19.6 | -10.1 | 1,500 | 15.4 | 1,763 | 14.0 | -9.1 |
| Esophagus | 913 | 5.3 | 1,189 | 5.2 | -1.9 | 716 | 9.0 | 942 | 9.0 | 0.0 | 197 | 2.0 | 247 | 1.9 | -5.0 |
| Hodgkin lymphoma | 42 | 0.3 | 43 | 0.2 | -33.3 | 25 | 0.3 | 25 | 0.3 | 0.0 | 17 | 0.2 | 18 | 0.2 | 0.0 |
| Kidney | 669 | 3.8 | 811 | 3.5 | -7.9 | 447 | 5.7 | 558 | 5.3 | -7.0 | 222 | 2.3 | 253 | 1.8 | -21.7 |
| Larynx | 130 | 0.7 | 136 | 0.6 | -14.3 | 109 | 1.4 | 122 | 1.1 | -21.4 | 21 | 0.2 | 14 | 0.1 | -50.0 |
| Leukemia | 1,212 | 6.9 | 1,559 | 6.4 | -7.2 | 708 | 9.1 | 914 | 8.2 | -9.9 | 505 | 5.2 | 646 | 4.9 | -5.8 |
| Liver | 1,454 | 8.4 | 2,089 | 8.9 | 6.0 | 916 | 11.5 | 1,268 | 11.6 | 0.9 | 538 | 5.7 | 821 | 6.5 | 14.0 |
| Lung | 7,124 | 40.5 | 7,830 | 32.7 | -19.3 | 3,648 | 45.7 | 4,022 | 36.4 | -20.4 | 3,476 | 36.4 | 3,808 | 29.5 | -19.0 |
| Melanoma | 580 | 3.4 | 715 | 3.1 | -8.8 | 378 | 4.9 | 466 | 4.4 | -10.2 | 202 | 2.2 | 251 | 2.1 | -4.5 |
| Myeloma | 620 | 3.5 | 779 | 3.2 | -8.6 | 349 | 4.4 | 453 | 4.1 | -6.8 | 271 | 2.8 | 326 | 2.5 | -10.7 |
| Non-Hodgkin lymphoma | 1,110 | 6.4 | 1,276 | 5.3 | -17.2 | 630 | 8.1 | 744 | 6.8 | -16.0 | 480 | 4.9 | 532 | 4.0 | -18.4 |
| Oral cavity & pharynx | 503 | 2.9 | 592 | 2.7 | -6.9 | 348 | 4.4 | 398 | 3.9 | -11.4 | 155 | 1.6 | 194 | 1.5 | -6.3 |
| Ovary | 723 | 7.9 | 850 | 7.4 | -6.3 | n/a | n/a | n/a | n/a | n/a | 723 | 7.9 | 850 | 7.4 | -6.3 |
| Pancreas | 2,152 | 12.3 | 2,948 | 12.5 | 1.6 | 1,084 | 13.7 | 1,470 | 13.7 | 0.0 | 1,068 | 11.1 | 1,478 | 11.5 | 3.6 |
| Prostate | 1,670 | 21.7 | 2,383 | 20.4 | -6.0 | 1,670 | 21.7 | 2,383 | 20.4 | -6.0 | n/a | n/a | n/a | n/a | n/a |
| Stomach | 788 | 4.6 | 992 | 4.5 | -2.2 | 481 | 6.2 | 600 | 5.7 | -8.1 | 307 | 3.3 | 392 | 3.4 | 3.0 |
| Testis | 14 | 0.2 | 13 | 0.2 | 0.0 | 14 | 0.2 | 13 | 0.2 | 0.0 | n/a | n/a | n/a | n/a | n/a |
| Thyroid | 95 | 0.5 | 128 | 0.5 | 0.0 | 47 | 0.6 | 64 | 0.6 | 0.0 | 48 | 0.5 | 64 | 0.5 | 0.0 |
| Uterus | 559 | 6.0 | 789 | 6.4 | 6.7 | n/a | n/a | n/a | n/a | n/a | 559 | 6.0 | 789 | 6.4 | 6.7 |
Abbreviation: ASMR means age-standardized mortality rate
Notes: Rates are per 100,000 and standardized to the age distribution of the 2011 Canadian population.
Analysis by: Surveillance, Analytics and Informatics, Ontario Health (Cancer Care Ontario)
Data source: Ontario Cancer Registry (December 2018), Ontario Health (Cancer Care Ontario)
Projected Mortality by Age
The anticipated change in cancer death counts and rates will vary by age group between 2020 and 2030.
Ages 0 to 39 years:
- The largest relative increase (more than 10%) in death rate is expected for breast cancer.
- Decreases are expected for stomach cancer, non-Hodgkin lymphoma, colorectal cancer, leukemia and brain cancer (Table 3.4).
Ages 40 to 59 years:
- Relative decreases in the death rate are expected to be highest for several cancers such as: Hodgkin lymphoma, prostate, laryngeal, lung, non-Hodgkin lymphoma, oral cavity & pharynx, melanoma, leukemia, bladder, esophageal, myeloma and liver.
- A large relative increase is expected for colorectal cancer.
Differences exist between the under 60 and over 60 age groups in both the types of cancers and the number of cancer types for which changes are expected.
Ages 60 to 79 years:
- Relative decreases in death rates will be largest for Hodgkin lymphoma, laryngeal, breast, lung, non-Hodgkin lymphoma, kidney and ovarian cancers
- A relative increase in death rates will be highest for liver, prostate and uterine cancers.
Ages 80 years and older (the oldest age group):
- This group is expected to experience the largest overall relative decrease in death rate (12.9%) between 2020 and 2030.
- As with the 60 to 79 year age group, relative decreases in death rates will be largest for the following cancers: testicular, Hodgkin lymphoma, colorectal, breast, lung, stomach, non-Hodgkin lymphoma and prostate. Relative increases in death rates are expected for uterine and liver cancers.
| Ages 0 - 39 years | Ages 40 - 59 years | Ages 60 - 79 years | Ages 80 years or older | |||||||||||||||||
|---|---|---|---|---|---|---|---|---|---|---|---|---|---|---|---|---|---|---|---|---|
| Deaths (2020) | Age-specific rate (2020) | Deaths (2030) | Age-specific rate (2030) | % change in age-specific rate | Deaths (2020) | Age-specific rate (2020) | Deaths (2030) | Age-specific rate (2030) | % change in age-specific rate | Deaths (2020) | Age-specific rate (2020) | Deaths (2030) | Age-specific rate (2030) | % change in age-specific rate | Deaths (2020) | Age-specific rate (2020) | Deaths (2030) | Age-specific rate (2030) | % change in age-specific rate | |
| All cancers | 399 | 5.7 | 395 | 5.3 | -7.0 | 3,797 | 97.0 | 3,485 | 87.3 | -10.0 | 15,636 | 530.1 | 18,313 | 500.0 | -5.7 | 11,143 | 1,617.5 | 15,158 | 1,409.5 | -12.9 |
| Bladder | ** | ** | ** | ** | ** | 49 | 1.3 | 43 | 1.1 | -15.4 | 401 | 13.6 | 501 | 13.7 | 0.7 | 531 | 77.1 | 819 | 76.2 | -1.2 |
| Brain | 75 | 1.1 | 77 | 1.0 | -9.1 | 231 | 5.9 | 224 | 5.6 | -5.1 | 490 | 16.6 | 634 | 17.3 | 4.2 | 149 | 21.6 | 229 | 21.3 | -1.4 |
| Breast (female) | 57 | 1.6 | 62 | 1.7 | 6.2 | 442 | 22.2 | 454 | 22.1 | -0.5 | 843 | 54.8 | 881 | 46.4 | -15.3 | 638 | 155.5 | 786 | 128.0 | -17.7 |
| Cervix | 17 | 0.5 | 18 | 0.5 | 0.0 | 71 | 3.6 | 77 | 3.8 | 5.6 | 69 | 4.5 | 92 | 4.8 | 6.7 | 28 | 6.8 | 39 | 6.4 | -5.9 |
| Colorectal | 30 | 0.4 | 16 | 0.2 | -50.0 | 368 | 9.4 | 417 | 10.5 | 11.7 | 1,452 | 49.2 | 1,747 | 47.7 | -3.0 | 1,344 | 195.1 | 1,666 | 154.9 | -20.6 |
| Esophagus | ** | ** | 7 | 0.1 | ** | 143 | 3.7 | 128 | 3.2 | -13.5 | 515 | 17.5 | 656 | 17.9 | 2.3 | 250 | 36.3 | 398 | 37.0 | 1.9 |
| Hodgkin lymphoma | 6 | 0.1 | 6 | 0.1 | 0.0 | 6 | 0.2 | ** | ** | ** | 20 | 0.7 | 20 | 0.5 | -28.6 | 10 | 1.5 | 12 | 1.1 | -26.7 |
| Kidney | ** | ** | ** | ** | ** | 87 | 2.2 | 80 | 2.0 | -9.1 | 335 | 11.4 | 374 | 10.2 | -10.5 | 243 | 35.3 | 352 | 32.7 | -7.4 |
| Larynx | 0 | 0.0 | 0 | 0.0 | 0.0 | 12 | 0.3 | 8 | 0.2 | -33.3 | 73 | 2.5 | 70 | 1.9 | -24.0 | 45 | 5.5 | 58 | 5.4 | -1.8 |
| Leukemia | 44 | 0.6 | 40 | 0.5 | -16.7 | 104 | 2.7 | 89 | 2.2 | -18.5 | 558 | 18.9 | 692 | 18.9 | 0.0 | 506 | 73.5 | 738 | 68.6 | -6.7 |
| Liver | 18 | 0.3 | 27 | 0.3 | 0.0 | 183 | 4.7 | 163 | 4.1 | -12.8 | 838 | 28.4 | 1,193 | 32.6 | 14.8 | 415 | 60.2 | 706 | 65.6 | 9.0 |
| Lung | 15 | 0.2 | 16 | 0.2 | 0.0 | 702 | 17.9 | 539 | 13.5 | -24.6 | 4,256 | 144.3 | 4,500 | 122.9 | -14.8 | 2,151 | 312.2 | 2,775 | 258.0 | -17.4 |
| Melanoma | 18 | 0.3 | 24 | 0.3 | 0.0 | 92 | 2.4 | 77 | 1.9 | -20.8 | 277 | 9.4 | 320 | 8.7 | -7.4 | 193 | 28.0 | 294 | 27.3 | -2.5 |
| Myeloma | 0 | 0.0 | 0 | 0.0 | 0.0 | 59 | 1.5 | 52 | 1.3 | -13.3 | 330 | 11.2 | 402 | 11.0 | -1.8 | 231 | 33.5 | 325 | 30.2 | -9.9 |
| Non-Hodgkin lymphoma | 15 | 0.2 | 9 | 0.1 | -50.0 | 117 | 3.0 | 92 | 2.3 | -23.3 | 546 | 18.5 | 595 | 16.2 | -12.4 | 432 | 62.7 | 580 | 53.9 | -14.0 |
| Oral cavity & pharynx | ** | ** | ** | ** | ** | 93 | 2.4 | 77 | 1.9 | -20.8 | 282 | 9.6 | 330 | 9.0 | -6.3 | 124 | 18.0 | 183 | 17.0 | -5.6 |
| Ovary | 10 | 0.3 | 8 | 0.3 | 0.0 | 128 | 6.4 | 135 | 6.6 | 3.1 | 388 | 25.2 | 437 | 23.0 | -8.7 | 197 | 48.0 | 270 | 44.0 | -8.3 |
| Pancreas | 9 | 0.2 | 10 | 0.2 | 0.0 | 264 | 6.7 | 251 | 6.3 | -6.0 | 1,177 | 39.9 | 1,574 | 43.0 | 7.8 | 702 | 101.9 | 1,113 | 103.5 | 1.6 |
| Prostate | 0 | 0.0 | 0 | 0.0 | 0.0 | 53 | 2.8 | 35 | 1.8 | -35.7 | 672 | 47.7 | 966 | 54.7 | 14.7 | 945 | 339.1 | 1,382 | 299.5 | -11.7 |
| Stomach | 12 | 0.2 | 9 | 0.1 | -50.0 | 131 | 3.3 | 134 | 3.4 | 3.0 | 381 | 12.9 | 506 | 13.8 | 7.0 | 262 | 38.0 | 342 | 31.8 | -16.3 |
| Testis | ** | ** | ** | ** | ** | ** | ** | ** | ** | ** | ** | ** | ** | ** | ** | ** | ** | ** | ** | ** |
| Thyroid | 0 | 0.0 | 0 | 0.0 | 0.0 | 12 | 0.3 | 12 | 0.3 | 0.0 | 50 | 1.7 | 65 | 1.8 | 5.9 | 33 | 4.8 | 51 | 4.7 | -2.1 |
| Uterus | ** | ** | ** | ** | ** | 77 | 3.9 | 77 | 3.8 | -2.6 | 326 | 21.2 | 444 | 23.4 | 10.4 | 153 | 37.3 | 264 | 43.0 | 15.3 |
Symbol: **Suppressed due to small case counts (less than 6).
Notes: Rates are per 100,000 and standardized to the age distribution of the 2011 Canadian population.
Analysis by: Surveillance, Analytics and Informatics, Ontario Health (Cancer Care Ontario)
Data source: Ontario Cancer Registry (December 2018), Ontario Health (Cancer Care Ontario)
Long-term cancer incidence and mortality projections inherently carry some uncertainty. The reliability of projections depends on several factors including:
- the accuracy of the population forecasts
- factors that can quickly change cancer incidence or mortality rates, such as the introduction of new or more sensitive early detection tests (e.g., HPV testing for cervical screening or fecal immunochemical test [FIT] for colorectal cancer screening) or the introduction of a new treatment (e.g. immunotherapy)
Comparing long-term cancer projections with current data provides a useful benchmark for evaluating existing prevention and treatment interventions. Predictions are also important for future healthcare and prevention planning. Projections help health planners and policy-makers anticipate the resources needed to prevent, screen for and diagnose cancer; treat newly diagnosed cancer patients; provide palliative and end-of-life services; and provide ongoing care to cancer survivors.