
Ontario Cancer Statistics 2022 Ch 6: Cancer Survival
Relative survival measures the likelihood of someone diagnosed with cancer surviving for a certain amount of time compared with similar people in the general population. This chapter focuses on 5-year relative cancer survival for adults and overall cancer survival proportion for children in Ontario.
What's on this page
Survival statistics are a key indicator of prognosis, as well as the effectiveness of control programs and cancer treatment.(1) Relative survival ratios show the likelihood of surviving for a certain amount of time (e.g., 1, 3 or 5 years) after diagnosis compared with similar people (i.e., same age and sex) in the general population.
The first 5 years after diagnosis are critical for examining survival because it is when someone is most likely to access healthcare services, including primary treatment and clinical assessment for recurrence. After 5 years, use of the healthcare system and the chance of recurrence decrease.
Cancer survival depends on factors such as cancer type, sex, age at diagnosis, stage at diagnosis and type of treatment. Relative survival ratios represent the average survival expected for a group of people with a certain type of cancer, so these statistics will not reflect the prognosis of every individual. Someone’s survival can also depend on their health status, the presence of comorbidities, and other personal and tumour-related factors. Survival estimates are based on data from people diagnosed in the past, which means they may not reflect the impact of more recent advances in cancer detection and treatment. Relative survival also does not distinguish between people who have no evidence of cancer and those who have relapsed or are still in treatment.
Survival improves over time due to better methods for (and the greater use of) early detection and more effective treatments. Even small improvements in survival rates can, at the population level, represent large numbers of people who avoid premature deaths.(2) Improvements in survival may also be the result of increased incidence through improved early detection. Catching cancers earlier than they would normally be found results in a “lead time bias.”(3) Lead time bias is when cancers are detected that would never have caused harm if left untreated (i.e., over-diagnosis) and causes an artificial improvement in population-level cancer survival.
Survival by Sex and Cancer Type
From 2014 to 2018, the 5-year relative survival ratio for all cancers combined was 67.2% (Table 6.1), which means people diagnosed with cancer during this period were 67.2% as likely to survive at least 5 years after diagnosis compared with similar people without cancer in the general population.
People diagnosed with cancer during this period were 67.2% as likely to survive at least 5 years after diagnosis compared with similar people without cancer in the general population
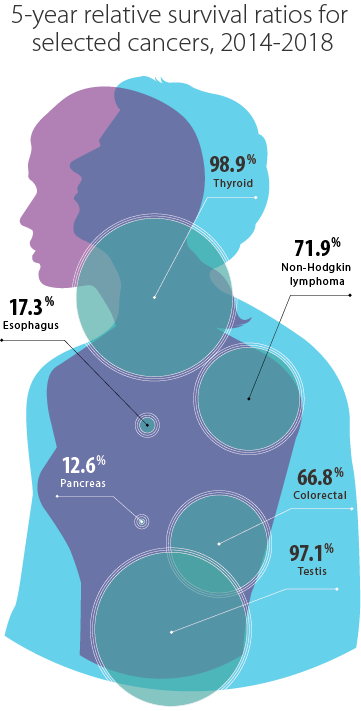
For cancer types that occur in males and females, 5-year survival was:
- highest for thyroid cancer (98.9%), melanoma (88.7%) and Hodgkin lymphoma (88.2%)
- lowest for pancreatic (12.6%), esophageal (17.3%), liver (22.8%) and lung (24.8%) cancers, mainly because most cases of these cancers (with the exception of liver cancer) are diagnosed at an advanced stage (4)
For cancers with high mortality rates (particularly pancreatic cancer), relative survival estimates are generally higher in Ontario than in other provinces, possibly due to differences in survival methodology. Ontario’s methodology assumes that people who are lost to follow-up are still alive at the cut-off date of 5 years after diagnosis, which can result in an overestimation of survival.(5) For high-mortality cancers, being alive longer than 5 years is very unlikely. This assumption that people lost to follow-up are still alive at the cut-off date is particularly problematic for Ontario because evidence shows that the loss to follow-up rate is higher in Ontario than in other provinces. The reasons for this higher rate are unclear. Therefore, survival estimates for pancreatic, esophageal, liver and lung cancers should be interpreted with caution, especially when comparing with other jurisdictions.
There was wide variation in 5-year relative survival ratio for the following cancers (Table 6.1):
- malignant compared with non-malignant brain cancers
- different subtypes of leukemia
- cutaneous compared with non-cutaneous melanoma
- endometrial compared with uterine sarcoma
- small cell compared with other types of lung cancer
Male survival from 2014 to 2018 (65.3%) was significantly lower than female survival (69.1%), which is a gap that has been widening over time. This difference likely results from generally higher survival rates in females than males for cancer types found in all people, particularly for lung cancer, which is the leading cause of cancer death in Ontario.
For males, 5-year survival was:
- highest for thyroid (97.7%), testicular (97.1%) and prostate (94.0%) cancers
- lowest for pancreatic (12.7%), esophageal (18.2%) and lung (20.8%) cancers
For females, 5-year survival was:
- highest for thyroid cancer (99.2%), melanoma (90.7%) and breast cancer (89.3%)
- lowest for pancreatic (12.5%), esophageal (14.5%) and liver (18.0%) cancers
| Cancer type | Males and females combined | Males | Females | |||
|---|---|---|---|---|---|---|
| RSR | 95% CI | RSR | 95% CI | RSR | 95% CI | |
| All cancers | 67.2 | 67.0 - 67.5 | 65.3 | 65.0 - 65.7 | 69.1 | 68.8 - 69.5 |
| Brain and nervous system | ||||||
| Brain and other nervous system - malignant | 28.6 | 26.8 - 30.5 | 27.1 | 24.8 - 29.5 | 30.7 | 27.9 - 33.5 |
| Glioblastoma | 7.8 | 6.3 - 9.4 | 8.2 | 6.3 - 10.4 | 7.2 | 5.1 - 9.8 |
| All other gliomas | 55.9 | 52.1 - 59.5 | 51.1 | 46.1 - 56.0 | 62.5 | 56.7 - 67.7 |
| Brain and other nervous system - non-malignant | 85.7 | 84.4 - 86.8 | 83.7 | 81.7 - 85.5 | 87.0 | 85.4 - 88.4 |
| Meningiomas | 92.1 | 90.0 - 93.8 | 86.7 | 82.0 - 90.2 | 94.4 | 92.0 - 96.2 |
| Pituitary, pineal and craniopharyngeal duct | 92.3 | 90.0 - 94.1 | 91.5 | 87.9 - 94.1 | 92.7 | 89.7 - 94.9 |
| Breast and genital system | ||||||
| Breast (female) | n/a | n/a | n/a | n/a | 89.3 | 88.7 - 89.8 |
| Cervix | n/a | n/a | n/a | n/a | 73.5 | 70.6 - 76.1 |
| Ovary | n/a | n/a | n/a | n/a | 47.7 | 45.7 - 49.7 |
| Prostate | n/a | n/a | 94.0 | 93.4 - 94.6 | n/a | n/a |
| Testis | n/a | n/a | 97.1 | 95.6 - 98.0 | n/a | n/a |
| Uterine | n/a | n/a | n/a | n/a | 82.7 | 81.6 - 83.8 |
| Uterus - endometrial | n/a | n/a | n/a | n/a | 85.6 | 84.5 - 86.7 |
| Uterus - uterine sarcoma | n/a | n/a | n/a | n/a | 48.9 | 40.9 - 56.5 |
| Digestive system | ||||||
| Colorectal | 66.8 | 65.9 - 67.6 | 66.7 | 65.5 - 67.8 | 67.0 | 65.7 - 68.2 |
| Colon excluding rectum | 65.5 | 64.5 - 66.6 | 65.7 | 64.2 - 67.2 | 65.3 | 63.8 - 66.8 |
| Colon - left sided | 69.5 | 67.9 - 71.1 | 69.4 | 67.1 - 71.5 | 69.8 | 67.2 - 72.1 |
| Colon - right sided | 66.8 | 65.4 - 68.2 | 66.9 | 64.8 - 68.9 | 66.7 | 64.8 - 68.6 |
| Rectum and rectosigmoid junction | 69.5 | 68.1 - 70.9 | 68.4 | 66.5 - 70.1 | 71.4 | 69.1 - 73.5 |
| Rectosigmoid junction | 65.0 | 62.0 - 67.8 | 64.3 | 60.4 - 68.0 | 66.0 | 61.3 - 70.3 |
| Rectum | 70.9 | 69.2 - 72.4 | 69.4 | 67.3 - 71.5 | 73.1 | 70.5 - 75.5 |
| Esophagus | 17.3 | 15.4 - 19.3 | 18.2 | 15.9 - 20.6 | 14.5 | 11.2 - 18.1 |
| Esophagus - adenocarcinoma | 18.3 | 15.8 - 21.0 | 19.2 | 16.4 - 22.1 | 14.4 | 9.6 - 20.1 |
| Esophagus - squamous cell carcinoma | 16.6 | 13.2 - 20.4 | 17.0 | 12.6 - 22.0 | 15.8 | 10.8 - 21.7 |
| Liver | 22.8 | 21.2 - 24.5 | 24.9 | 22.9 - 27.0 | 18.0 | 15.4 - 20.7 |
| Pancreas | 12.6 | 11.5 - 13.7 | 12.7 | 11.2 - 14.2 | 12.5 | 11.0 - 14.1 |
| Stomach | 34.4 | 32.5 - 36.2 | 32.2 | 29.9 - 34.4 | 38.0 | 35.0 - 41.1 |
| Head and neck | ||||||
| Larynx | 63.4 | 59.5 - 67.0 | 64.4 | 60.2 - 68.4 | 57.4 | 47.6 - 66.0 |
| Oral cavity and pharynx | 63.7 | 62.0 - 65.4 | 63.9 | 61.8 - 65.9 | 63.3 | 60.1 - 66.4 |
| Lip and oral cavity | 65.1 | 62.5 - 67.6 | 65.0 | 61.6 - 68.1 | 65.3 | 61.1 - 69.3 |
| Hypopharynx | 30.1 | 23.0 - 37.5 | 26.9 | 19.6 - 34.7 | 44.8 | 23.9 - 63.7 |
| Nasopharynx | 68.4 | 61.9 - 74.0 | 67.3 | 59.6 - 73.8 | 71.4 | 58.4 - 80.9 |
| Oropharynx | 67.6 | 64.8 - 70.2 | 68.7 | 65.5 - 71.6 | 63.3 | 56.9 - 69.0 |
| Thyroid | 98.9 | 98.5 - 99.1 | 97.7 | 96.2 - 98.6 | 99.2 | 98.8 - 99.5 |
| Thyroid - anaplastic | 5.9 | 1.3 - 15.7 | † | † | † | † |
| Thyroid - follicular | 98.4 | 92.1 - 99.7 | 95.6 | 84.0 - 98.9 | 99.1 | 85.8 - 99.9 |
| Thyroid - medullary | 90.4 | 79.6 - 95.6 | 86.6 | 66.5 - 95.0 | 93.2 | 79.4 - 97.9 |
| Thyroid - papillary | 99.9 | 99.7 - 100.0 | 99.9 | 99.3 - 100.0 | 99.9 | 99.5 - 100.0 |
| Hematological | ||||||
| Leukemia | 64.9 | 63.4 - 66.3 | 65.4 | 63.4 - 67.4 | 64.0 | 61.7 - 66.2 |
| Acute lymphocytic leukemia | 76.6 | 72.6 - 80.1 | 78.3 | 73.1 - 82.7 | 74.2 | 67.6 - 79.6 |
| Acute monocytic leukemia | 91.1 | 88.8 - 93.0 | 90.9 | 87.8 - 93.3 | 91.4 | 87.7 - 94.0 |
| Acute myeloid leukemia | 25.8 | 18.0 - 34.3 | 23.5 | 14.0 - 34.5 | 27.9 | 15.5 - 41.6 |
| Chronic lymphocytic leukemia | 28.4 | 25.7 - 31.1 | 26.5 | 23.0 - 30.2 | 30.6 | 26.7 - 34.7 |
| Chronic myeloid leukemia | 62.9 | 58.7 - 66.8 | 59.9 | 54.3 - 65.1 | 67.0 | 60.5 - 72.6 |
| Lymphoma | 73.4 | 72.4 - 74.4 | 72.4 | 71.0 - 73.8 | 74.7 | 73.2 - 76.1 |
| Hodgkin lymphoma | 88.2 | 85.8 - 90.3 | 89.2 | 85.8 - 91.8 | 87.1 | 83.2 - 90.2 |
| Non-Hodgkin lymphoma | 71.9 | 70.7 - 72.9 | 70.7 | 69.2 - 72.2 | 73.3 | 71.7 - 74.9 |
| Non-Hodgkin lymphoma - extranodal | 71.4 | 69.9 - 73.0 | 70.4 | 68.2 - 72.5 | 72.4 | 70.1 - 74.6 |
| Non-Hodgkin lymphoma - nodal | 72.3 | 70.7 - 73.8 | 70.9 | 68.7 - 72.9 | 74.0 | 71.7 - 76.2 |
| Myeloma | 54.8 | 52.6 - 56.9 | 53.8 | 50.9 - 56.6 | 56.0 | 52.9 - 59.1 |
| Melanoma | ||||||
| Melanoma of the skin | 88.7 | 87.6 - 89.7 | 87.0 | 85.3 - 88.4 | 90.7 | 89.2 - 92.1 |
| Melanoma (non-cutaneous) | 73.3 | 67.3 - 78.3 | 75.2 | 66.0 - 82.2 | 71.5 | 63.2 - 78.3 |
| Melanoma - mucosal | 47.0 | 34.1 - 58.9 | 50.7 | 26.6 - 70.5 | 44.6 | 29.8 - 58.4 |
| Melanoma - ocular | 80.5 | 73.8 - 85.6 | 78.1 | 68.2 - 85.3 | 82.9 | 73.1 - 89.5 |
| Thoracic system | ||||||
| Lung | 24.8 | 24.1 - 25.4 | 20.8 | 19.9 - 21.7 | 28.6 | 27.7 - 29.6 |
| Lung - adenocarcinoma | 32.6 | 31.5 - 33.7 | 27.4 | 25.8 - 29.0 | 36.7 | 35.2 - 38.2 |
| Lung - large cell | 21.5 | 16.7 - 26.8 | 21.2 | 14.7 - 28.6 | 21.7 | 14.7 - 29.5 |
| Lung - small cell | 6.9 | 5.9 - 8.1 | 5.8 | 4.5 - 7.4 | 8.0 | 6.5 - 9.7 |
| Lung - squamous cell | 24.9 | 23.3 - 26.5 | 23.7 | 21.7 - 25.7 | 26.9 | 24.3 - 29.5 |
| Urinary system | ||||||
| Bladder | 79.1 | 77.8 - 80.2 | 79.7 | 78.3 - 81.0 | 77.0 | 74.6 - 79.2 |
| Kidney | 79.0 | 77.7 - 80.3 | 79.5 | 77.8 - 81.1 | 78.1 | 75.7 - 80.2 |
Abbreviations: CI means confidence interval; RSR means relative survival ratio; n/a means not applicable.
Symbol: †Estimate could not be calculated.
Notes:
- The analysis was restricted to people ages 15 to 99.
- Bladder cancer includes carcinoma in situ cases.
Analysis by: Surveillance, Ontario Health (Cancer Care Ontario)
Data source: Ontario Cancer Registry (March 2021), Ontario Health (Cancer Care Ontario)
There were differences between males and females in 5-year survival for the following cancer types:
- Lung cancer survival was significantly higher in females (28.6%) than males (20.8%). One reason for this difference may be that males are more likely to have more aggressive lung cancer types, which have lower survival and are more likely to be diagnosed at a later stage.(6,7)
- Survival for melanoma was significantly higher in females (90.7%) than males (87.0%). Lower survival among males is due to biological differences that make this cancer more likely to spread in males.(8–10) Recent research has also suggested that the expression of the PR70 protein, which is linked to the X-chromosome and expressed in higher doses among females, may suppress melanoma tumours.(11)
- Lower bladder cancer survival in females (77.0% versus 79.7% in males) may be because:
- Females are typically diagnosed at a more advanced stage than males.
- There are differences in how males and females metabolize carcinogens.
- There is a greater presence of sex steroids in females that could affect the progression of this cancer. (12,13)
Survival by Age
From the 1984 to 1988 period to the 2014 to 2018 period, the 5-year age-standardized relative survival ratio for all ages and cancers combined rose from 49.6% to 65.9% (Figure 6.1).
As in previous periods, the 5-year relative survival ratio for all cancers combined in the 2014 to 2018 period decreased with advancing age. For example, the relative survival ratio was 88.7% for people diagnosed from ages 15 to 39, but just 44.9% for those diagnosed from ages 80 to 99.
People diagnosed at ages 80 to 99 saw little improvement in 5-year survival from the 1984 to 1988 period to the 2014 to 2018 period. This lack of improvement is mainly because people in this age group are more likely to have comorbidities and less likely to receive aggressive treatment for cancer. People diagnosed at ages 40 to 79 showed the greatest improvement in 5-year relative survival. As a result, the gap in survival between the oldest age group and the younger age groups widened over time. A European study comparing people ages 55 to 69 with those ages 70 to 84 showed that the greater improvements in survival among people under age 80 may partly be due to the greater use of population-based screening programs for breast and colorectal cancers, and use of the prostate specific antigen test for prostate cancer.(14)
In Ontario, 83.3% of children ages 0 to 14 diagnosed with cancer from 2015 to 2019 were estimated to survive 5 years (i.e., 5-year overall survival proportion). Overall survival proportion is an estimate of the probability of surviving all causes of death. Children with cancer continued to experience gains in survival, with the 5-year overall survival proportion increasing from 76.9% during the 1990 to 1994 period to 83.3% in the latest 5-year period (2015 to 2019) (see Spotlight: Childhood Cancer Survival Trend, Figure 6.S1).
For more details on childhood cancer survival trends, read the Pediatric Oncology Group of Ontario Surveillance Report.
Spotlight: Childhood Cancer Survival Trends
Survival Trends by Cancer Type
The relative survival ratio for all cancers combined in Ontario increased each decade from 1984 to 2018, but the rate of increase dropped from 2008 to 2018 compared with previous periods. More specifically, of the 16.5 percentage point increase from 1984 to 2018, the largest improvement in survival occurred from the 1984 to 1988 period to the 1994 to 1998 period (7.4 percentage points), compared with only 2.5 percentage points from the 2004 to 2008 period to the 2014 to 2018 period (Table 6.2).
| Cancer type | 1984 to 1988 | 1994 to 1998 | 2004 to 2008 | 2014 to 2018 | ||||
|---|---|---|---|---|---|---|---|---|
| RSR (%) | 95% CI | RSR (%) | 95% CI | RSR (%) | 95% CI | RSR (%) | 95% CI | |
| All cancers | 49.5 | 49.2-49.8 | 56.9 | 56.7-57.2 | 63.5 | 63.3-63.7 | 66.0 | 65.7-66.3 |
| Brain and nervous system | ||||||||
| Brain and other nervous system - malignant | 26.4 | 25.0-27.9 | 29.8 | 28.4-31.2 | 34.0 | 32.7-35.4 | 30.8 | 29.0-32.6 |
| Glioblastoma | 6.6 | 5.0-8.6 | 7.8 | 6.3-9.6 | 9.3 | 7.4-11.4 | 13.7 | 11.0-16.8 |
| All other gliomas | 27.4 | 25.1-29.7 | 33.4 | 30.7-36.2 | 39.7 | 37.3-42.1 | 44.6 | 41.0-48.2 |
| Brain and other nervous system - non-malignant | † | † | † | † | † | † | † | † |
| Meningiomas | † | † | † | † | † | † | † | † |
| Pituitary, pineal and craniopharyngeal duct | † | † | † | † | † | † | † | † |
| Breast and genital system | ||||||||
| Breast (female) | 75.0 | 74.2-75.9 | 84.2 | 83.6-84.9 | 86.7 | 86.1-87.2 | 89.3 | 88.6-89.9 |
| Cervix | 64.5 | 62.4-66.6 | 67.1 | 65.0-69.1 | 67.7 | 65.5-69.8 | 70.4 | 67.3-73.2 |
| Ovary | 31.0 | 29.3-32.7 | 36.7 | 35.2-38.3 | 42.2 | 40.7-43.7 | 43.1 | 41.1-45.1 |
| Prostate | 70.4 | 69.1-71.7 | 88.2 | 87.5-88.9 | 94.7 | 94.2-95.1 | 92.1 | 91.4-92.8 |
| Testis | 83.9 | 79.1-87.6 | 88.6 | 83.5-92.1 | 93.4 | 89.6-95.9 | 92.6 | 84.5-96.6 |
| Uterine | 81.0 | 79.3-82.6 | 82.2 | 80.8-83.6 | 81.7 | 80.5-82.9 | 80.5 | 79.0-81.8 |
| Uterus - endometrial | 83.6 | 81.7-85.3 | 84.8 | 83.3-86.2 | 84.7 | 83.4-85.9 | 83.6 | 82.2-84.9 |
| Uterus - uterine sarcoma | 45.3 | 33.5-56.3 | 41.8 | 33.5-49.8 | 39.9 | 32.4-47.2 | 36.3 | 27.2-45.4 |
| Digestive system | ||||||||
| Colorectal | 52.1 | 51.3-52.8 | 57.2 | 56.5-57.9 | 65.5 | 64.9-66.1 | 68.2 | 67.3-69.0 |
| Colon excluding rectum | 54.1 | 53.2-55.0 | 57.3 | 56.5-58.2 | 65.6 | 64.9-66.3 | 67.3 | 66.3-68.3 |
| Colon - left sided | 55.4 | 53.9-56.8 | 60.6 | 59.2-61.9 | 69.6 | 68.5-70.7 | 70.2 | 68.6-71.8 |
| Colon - right sided | 54.7 | 53.3-56.0 | 57.5 | 56.2-58.7 | 64.6 | 63.6-65.6 | 67.9 | 66.5-69.2 |
| Rectum and rectosigmoid junction | 48.4 | 47.1-49.8 | 57.6 | 56.3-58.8 | 65.5 | 64.4-66.5 | 69.2 | 67.7-70.6 |
| Rectosigmoid junction | 44.0 | 41.3-46.7 | 58.2 | 55.9-60.4 | 63.5 | 61.5-65.3 | 65.1 | 62.2-67.9 |
| Rectum | 50.0 | 48.4-51.5 | 57.2 | 55.7-58.7 | 66.2 | 64.9-67.4 | 70.4 | 68.7-72.0 |
| Esophagus | 13.5 | 11.6-15.5 | 15.6 | 14.0-17.4 | 16.2 | 14.7-17.7 | 20.9 | 18.7-23.2 |
| Esophagus - adenocarcinoma | 12.6 | 9.3-16.5 | 12.5 | 10.3-14.9 | 14.6 | 12.7-16.5 | 21.8 | 19.1-24.6 |
| Esophagus - squamous cell carcinoma | 12.1 | 9.8-14.7 | 17.3 | 14.6-20.2 | 18.0 | 15.3-20.9 | 19.2 | 14.9-24.0 |
| Liver | 8.3 | 6.5-10.4 | 14.0 | 12.3-15.8 | 23.8 | 22.2-25.4 | 23.3 | 21.6-25.1 |
| Pancreas | 7.3 | 6.4-8.2 | 9.0 | 8.1-9.9 | 10.9 | 10.0-11.8 | 15.0 | 13.8-16.3 |
| Stomach | 20.0 | 18.7-21.3 | 23.9 | 22.6-25.2 | 29.3 | 28.0-30.6 | 35.8 | 34.0-37.6 |
| Head and neck | ||||||||
| Larynx | 63.4 | 60.1-66.5 | 64.9 | 62.0-67.7 | 65.5 | 62.8-68.1 | 63.6 | 59.4-67.6 |
| Oral cavity & pharynx | 54.6 | 52.6-56.5 | 55.5 | 53.6-57.2 | 60.1 | 58.5-61.7 | 60.7 | 58.8-62.6 |
| Lip and oral cavity | 68.2 | 65.6-70.6 | 66.7 | 64.3-69.1 | 67.4 | 65.2-69.5 | 63.9 | 61.2-66.4 |
| Hypopharynx | 19.4 | 15.0-24.2 | 24.6 | 19.7-29.8 | 33.2 | 27.8-38.7 | † | † |
| Nasopharynx | 47.8 | 42.1-53.3 | 60.3 | 55.1-65.1 | 65.7 | 61.1-69.9 | 66.9 | 59.7-73.2 |
| Oropharynx | 32.5 | 28.9-36.1 | 41.1 | 37.5-44.7 | 54.1 | 51.0-57.0 | 62.4 | 58.8-65.8 |
| Thyroid | 84.6 | 82.0-86.8 | 90.7 | 88.7-92.4 | 96.1 | 95.1-96.9 | 98.0 | 97.4-98.5 |
| Thyroid - anaplastic | 21.4 | 8.3-38.5 | 5.5 | 1.6-12.8 | 36.0 | 30.1-42.0 | † | † |
| Thyroid - follicular | 88.8 | 83.9-92.3 | 90.4 | 84.9-93.9 | 94.9 | 89.1-97.6 | 97.6 | 93.5-99.1 |
| Thyroid - medullary | 67.8 | 57.8-75.9 | 81.0 | 68.2-89.0 | 82.9 | 74.0-89.0 | 91.1 | 81.2-95.9 |
| Thyroid - papillary | 93.5 | 89.0-96.2 | 96.8 | 93.2-98.5 | 98.8 | 98.0-99.3 | 99.7 | 99.1-99.9 |
| Hematological | ||||||||
| Leukemia | 39.2 | 37.6-40.7 | 44.3 | 42.9-45.7 | 55.9 | 54.7-57.1 | 64.0 | 62.5-65.5 |
| Acute lymphocytic leukemia | 27.7 | 22.5-33.2 | 29.5 | 24.5-34.8 | 52.5 | 47.4-57.3 | 62.9 | 57.0-68.3 |
| Acute monocytic leukemia | 68.0 | 65.2-70.5 | 72.5 | 70.3-74.6 | 81.0 | 79.4-82.5 | 91.1 | 88.9-92.9 |
| Acute myeloid leukemia | 4.1 | 0.8-12.3 | 14.8 | 9.1-22.0 | 14.4 | 8.8-21.5 | 25.4 | 18.3-33.2 |
| Chronic lymphocytic leukemia | 11.1 | 9.3-13.1 | 13.5 | 11.8-15.4 | 16.3 | 14.8-17.9 | 26.3 | 23.8-29.0 |
| Chronic myeloid leukemia | 27.9 | 24.1-31.7 | 33.2 | 29.8-36.7 | 59.4 | 55.8-62.8 | 61.0 | 57.0-64.7 |
| Lymphoma | 50.3 | 48.8-51.8 | 52.0 | 50.8-53.2 | 64.0 | 63.0-65.0 | 72.5 | 71.4-73.5 |
| Hodgkin lymphoma | 72.4 | 69.9-74.6 | 79.9 | 77.7-81.9 | 82.9 | 80.9-84.7 | 86.5 | 84.1-88.5 |
| Non-Hodgkin lymphoma | 49.9 | 48.3-51.5 | 50.7 | 49.5-52.0 | 63.6 | 62.6-64.5 | 72.2 | 71.1-73.3 |
| Non-Hodgkin lymphoma - extranodal | 48.6 | 47.0-50.2 | 49.2 | 47.9-50.5 | 61.4 | 60.4-62.5 | 71.2 | 69.6-72.7 |
| Non-Hodgkin lymphoma - nodal | 81.5 | 71.7-88.2 | 71.9 | 66.3-76.7 | 79.5 | 76.5-82.1 | 73.2 | 71.7-74.7 |
| Myeloma | 31.9 | 29.7-34.1 | 34.9 | 33.1-36.8 | 44.2 | 42.5-45.9 | 58.1 | 56.1-60.1 |
| Melanoma | ||||||||
| Melanoma of the skin | 83.6 | 82.2-85.0 | 84.4 | 83.3-85.5 | 87.7 | 86.8-88.4 | 91.4 | 90.5-92.2 |
| Melanoma (non-cutaneous) | 76.2 | 70.6-80.8 | 83.6 | 78.3-87.7 | 79.2 | 74.7-82.9 | 76.7 | 70.8-81.6 |
| Melanoma - mucosal | 73.5 | 52.9-86.2 | 58.8 | 37.7-74.9 | 52.9 | 35.1-67.9 | 51.4 | 34.8-65.8 |
| Melanoma - ocular | 76.2 | 70.3-81.0 | 85.8 | 80.4-89.8 | 81.8 | 77.5-85.4 | 83.3 | 77.3-87.8 |
| Thoracic system | ||||||||
| Lung | 14.4 | 13.9-14.9 | 16.5 | 16.0-16.9 | 18.9 | 18.4-19.3 | 26.8 | 26.0-27.6 |
| Lung - adenocarcinoma | 19.7 | 18.4-21.0 | 21.9 | 20.8-22.9 | 25.5 | 24.6-26.4 | 32.5 | 31.2-33.7 |
| Lung - large cell | 9.6 | 7.9-11.5 | 8.8 | 7.3-10.3 | 13.9 | 11.7-16.3 | † | † |
| Lung - small cell | 6.5 | 5.3-7.7 | 7.4 | 6.4-8.5 | 7.3 | 6.3-8.3 | † | † |
| Lung - squamous cell | 17.9 | 16.8-19.1 | 19.2 | 18.1-20.4 | 23.9 | 22.4-25.5 | † | † |
| Urinary system | ||||||||
| Bladder | 75.9 | 74.6-77.2 | 73.1 | 71.8-74.4 | 69.2 | 68.0-70.4 | 65.2 | 63.4-67.0 |
| Kidney | 52.6 | 50.5-54.6 | 61.8 | 60.0-63.5 | 68.7 | 67.3-70.0 | 77.4 | 75.8-79.0 |
Abbreviations: CI means confidence interval; RSR means relative survival ratio.
Symbol: †Statistic could not be calculated.
Notes:
- Analysis was restricted to ages 15 to 99.
- The period method was used to derive relative survival ratios for the 2014 to 2018 period. The cohort method was used for all other periods.
- International Agency for Research on Cancer/International Association of Cancer Registries multiple primary rules used when presenting trends over time.
- Relative survival ratios were age-standardized using the International Cancer Survival Standards.
- Bladder cancer includes malignant cases only (bladder carcinoma in situ cases are excluded).
Analysis by: Surveillance, Ontario Health (Cancer Care Ontario)
Data source: Ontario Cancer Registry (March 2021), Ontario Health (Cancer Care Ontario)
From the 1984 to 1988 period to the 2014 to 2018 period, most cancers experienced increases in survival (Figure 6.2). The gains in survival were greatest for the following cancers:
- myeloma (a 26.2 percentage point increase)
- kidney cancer (24.8)
- leukemia (24.8) and several subtypes
- lymphoma (22.2) and several subtypes
- prostate (21.7)
- rectum and rectosigmoid junction (20.8)
- nasopharynx (19.1) and oropharynx (29.9)
Notable increases were also seen for the following cancers:
- colorectal (including its subsites) (a 16.1 percentage point increase)
- stomach (15.8)
- liver (15.0)
- breast (14.3)
- thyroid (13.4)
- lung (12.4)
Smaller gains in survival occurred for cervical, endometrial and laryngeal cancers, and melanoma of the skin. A downward trend in survival was observed for the following cancers:
- mucosal melanoma (a 22.1 percentage point decrease)
- squamous cell lung (17.9) and small cell lung (6.5)
- bladder (10.7, for malignant cases only)
- lip and oral cavity (4.3)
When comparing colorectal cancer subsites, the rectal cancer survival rate was lower than the colon cancer survival rate in the 1984 to 1988 period. Survival for both subsites increased over time, but the disparity in survival between the subsites decreased, with rectal cancer survival nearly catching up to colon cancer survival by the 2014 to 2018 period. Similarly, survival rates for the subsites for oral cavity and pharynx cancers became increasingly similar over time and were approximately the same by the 2014 to 2018 period, with the exception of hypopharynx. In the 2014 to 2018 period, non-Hodgkin lymphoma survival also approached the survival of Hodgkin lymphoma, even though Hodgkin lymphoma still had a higher relative survival ratio.
Survival by Duration
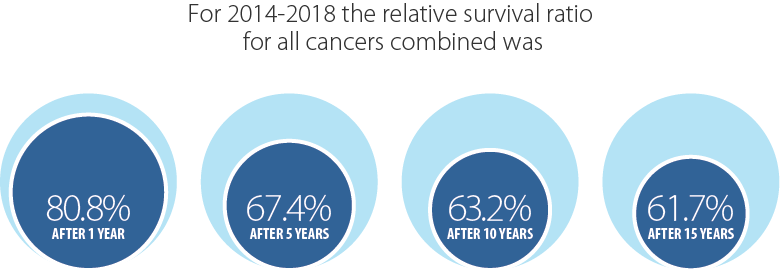
In the 2014 to 2018 period, the relative survival ratio for all cancers combined was 80.8% after 1 year, 67.4% after 5 years, 63.2% after 10 years and 61.7% after 15 years (Figure 6.3).
As for most individual cancer types, survival for all cancers combined decreased most during the first year after diagnosis, followed by progressively smaller decreases in survival as the time from diagnosis progressed. Some of the largest drops in survival in the first year after diagnosis were for pancreatic, liver, esophageal, lung, brain, stomach and ovarian cancers, as well as leukemia.
For the 4 most common cancers, the following trends were observed for relative survival by duration:
- For breast cancer, the relative survival ratio 1 year after diagnosis was very high at 97.5%. At 5 years, the relative survival ratio fell to 89.5%. Survival at 10 years decreased slightly to 83.9% and at 15 years to 81.2%.
- For colorectal cancer, the relative survival ratio 1 year after diagnosis was 82.9%, but fell to 67.1% at 5 years. There was no significant difference between the 10-year and 15-year relative survival ratios for colorectal cancer.
- Lung cancer had one of the greatest drops in survival from 1 to 5 years after diagnosis, falling from 50.9% to just 24.8%. Survival continued to decrease significantly to 17.9% at 10 years and 15.1% at 15 years.
- Prostate cancer survival decreased by a small, but significant, amount from 1 to 5 years after diagnosis, but there was no significant difference between 5-year, 10-year and 15-year survival. In fact, the 10-year and 15-year relative survival ratios were nearly the same (93.1% and 93.0%, respectively).
Survival by Stage
Stage at diagnosis is one of the most important predictors of cancer survival. Population-level stage data in Ontario were available from 2010 to 2018 for the 4 most common cancers (breast, colorectal, lung and prostate) and cervical cancer, as well as for a limited number of years for thyroid cancer and melanoma. This section focuses on the 4 most common cancers.
Five-year relative survival from 2014 to 2018 tended to decrease with advancing stage at diagnosis (Figure 6.4). The level of decrease varied by cancer type:
- While breast cancer cases diagnosed at stage 1 had a 5-year relative survival ratio of 100.0%, the relative survival ratio decreased to just 29.2% for cases diagnosed at stage 4.
- Colorectal cancer cases diagnosed at stage 1 had a 5-year relative survival ratio of 93.5%, which decreased to 86.4% for cases diagnosed at stage 2, 70.7% at stage 3 and just 13.9% at stage 4.
- Of the 4 most common cancers, lung cancer had the lowest survival at every stage. Even at stage 1, 5-year survival was just 67.7%, decreasing to 5.4% at stage 4.
- Stage at diagnosis had the least effect on prostate cancer. Five-year survival for stages 1 to 3 was 100.0%; however, survival dropped to 47.0% for cases diagnosed at stage 4.
Five-year relative survival from 2014 to 2018 tended to decrease with advancing stage at diagnosis (Figure 6.4). The level of decrease varied by cancer type.
Conditional Survival
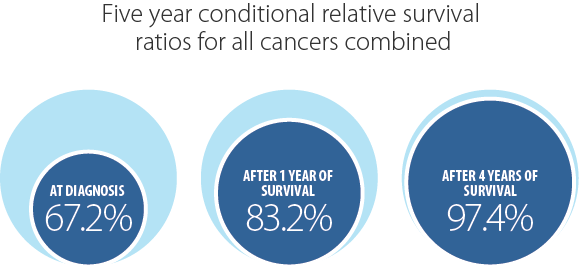
Relative survival ratios represent the likelihood of surviving a specific number of years after diagnosis. However, sometimes it is useful to measure survival starting at a time other than the date of diagnosis. Because people are more likely to die in the first year following diagnosis, survival after the first year (also called 1-year conditional survival) may be very different from survival measured at diagnosis. Table 6.3 presents survival at 5 years after diagnosis after already having survived 0 (the equivalent of non-conditional survival), 1, 2, 3 and 4 years.
While the 5-year relative survival ratio measured from diagnosis for all cancers combined from 2014 to 2018 was 67.2%, the 5-year relative survival ratio increased to 83.2% for people who survived the first year after diagnosis. The 5-year relative survival ratio increased for each year someone survived until 4 years after diagnosis, when it was 97.4%.
In general, once someone has survived the first year after diagnosis, their chance of surviving 5 years continues to increase, but that increase gets smaller for each year they survive. For example, the 5-year survival for colorectal cancer increases by 13.6% after surviving the first year (66.8% to 80.4%), but only increases by 7% after surviving the second year (from 80.4% to 87.1%).
People who have cancers with a poor prognosis (e.g., pancreatic, esophageal, liver, lung, stomach, brain) showed the highest relative gain in survival once they survived the first year after diagnosis. For example, while the 5-year relative survival ratio for pancreatic cancer was only 12.6% at diagnosis, it rose to 38.8% for people who survived their first year. Cancers with a good prognosis (e.g., thyroid, testicular, prostate, breast) showed only a small difference in 1-year conditional relative survival ratio because survival at diagnosis was already high.
| Cancer type | 0 years survived† | 1 years survived | 2 years survived | 3 years survived | 4 years survived | |||||
|---|---|---|---|---|---|---|---|---|---|---|
| RSR (%) | 95% CI | RSR (%) | 95% CI | RSR (%) | 95% CI | RSR (%) | 95% CI | RSR (%) | 95% CI | |
| All cancers | 67.2 | 67.0-67.5 | 83.2 | 83.0-83.5 | 90.0 | 89.7-90.2 | 94.3 | 94.1-94.4 | 97.4 | 97.3-97.5 |
| Brain and nervous system | ||||||||||
| Brain and other nervous system - malignant | 28.6 | 26.8-30.5 | 52.4 | 49.6-55.0 | 75.4 | 72.4-78.1 | 87.9 | 85.4-90.0 | 95.2 | 93.4-96.5 |
| Glioblastoma | 7.8 | 6.3-9.4 | 18.4 | 15.1-22.0 | 41.0 | 34.3-47.5 | 65.3 | 56.4-72.8 | 83.5 | 74.6-89.6 |
| All other gliomas | 55.9 | 52.1-59.5 | 71.9 | 67.9-75.4 | 83.6 | 80.0-86.7 | 91.0 | 88.0-93.3 | 96.4 | 94.2-97.8 |
| Brain and other nervous system - non-malignant | 85.7 | 84.4-86.8 | 94.1 | 93.0-95.0 | 95.8 | 94.8-96.6 | 97.3 | 96.5-97.9 | 98.8 | 98.2-99.2 |
| Meningiomas | 92.1 | 90.0-93.8 | 95.7 | 93.7-97.1 | 96.5 | 94.6-97.7 | 97.4 | 95.8-98.4 | 98.6 | 97.3-99.3 |
| Pituitary, pineal and craniopharyngeal duct | 92.3 | 90.0-94.1 | 96.5 | 94.4-97.9 | 98.4 | 96.2-99.3 | 98.8 | 96.9-99.5 | 99.3 | 97.7-99.8 |
| Breast and genital system | ||||||||||
| Breast (female) | 89.3 | 88.7-89.8 | 91.6 | 91.1-92.1 | 93.8 | 93.4-94.2 | 95.9 | 95.5-96.3 | 97.9 | 97.6-98.2 |
| Cervix | 73.5 | 70.6-76.1 | 82.6 | 79.9-85.0 | 89.9 | 87.5-91.9 | 94.4 | 92.4-95.8 | 97.6 | 96.1-98.5 |
| Ovary | 47.7 | 45.7-49.7 | 62.3 | 60.0-64.5 | 73.7 | 71.3-75.8 | 85.0 | 82.9-86.8 | 92.6 | 90.9-94.0 |
| Prostate | 94.0 | 93.4-94.6 | 95.6 | 95.0-96.1 | 97.2 | 96.6-97.6 | 98.4 | 97.9-98.7 | 99.3 | 99.0-99.6 |
| Testis | 97.1 | 95.6-98.0 | 98.5 | 97.2-99.2 | 99.1 | 97.9-99.6 | 99.7 | 98.6-99.9 | 99.9 | 99.2-100.0 |
| Uterine | 82.7 | 81.6-83.8 | 89.0 | 87.9-89.9 | 93.4 | 92.5-94.2 | 96.2 | 95.4-96.8 | 98.5 | 97.9-98.9 |
| Uterus - endometrial | 85.6 | 84.5-86.7 | 90.1 | 89.1-91.1 | 94.0 | 93.1-94.8 | 96.4 | 95.6-97.1 | 98.6 | 98.0-99.0 |
| Uterus - uterine sarcoma | 48.9 | 40.9-56.5 | 64.5 | 54.9-72.6 | 77.7 | 67.2-85.2 | 86.4 | 75.5-92.7 | 94.0 | 82.6-98.0 |
| Digestive system | ||||||||||
| Colorectal | 66.8 | 65.9-67.6 | 80.4 | 79.6-81.3 | 87.1 | 86.3-87.9 | 92.8 | 92.1-93.4 | 96.6 | 96.1-97.1 |
| Colon excluding rectum | 65.5 | 64.5-66.6 | 80.8 | 79.7-81.9 | 87.8 | 86.8-88.8 | 93.5 | 92.6-94.2 | 97.0 | 96.4-97.6 |
| Colon - left sided | 69.5 | 67.9-71.1 | 81.5 | 79.8-83.0 | 87.0 | 85.5-88.4 | 92.4 | 91.1-93.5 | 96.2 | 95.2-97.0 |
| Colon - right sided | 66.8 | 65.4-68.2 | 81.2 | 79.7-82.5 | 88.7 | 87.4-90.0 | 94.4 | 93.2-95.4 | 97.7 | 96.8-98.4 |
| Rectum and rectosigmoid junction | 69.5 | 68.1-70.9 | 79.7 | 78.3-81.1 | 85.8 | 84.5-87.0 | 91.5 | 90.4-92.5 | 95.8 | 95.0-96.6 |
| Rectosigmoid junction | 65.0 | 62.0-67.8 | 79.0 | 76.0-81.6 | 85.0 | 82.3-87.4 | 90.4 | 88.0-92.3 | 94.6 | 92.7-96.1 |
| Rectum | 70.9 | 69.2-72.4 | 80.0 | 78.4-81.5 | 86.1 | 84.6-87.5 | 92.0 | 90.7-93.1 | 96.3 | 95.3-97.1 |
| Esophagus | 17.3 | 15.4-19.3 | 37.7 | 33.9-41.5 | 63.2 | 58.0-67.9 | 80.7 | 75.5-84.9 | 92.6 | 88.3-95.3 |
| Esophagus - adenocarcinoma | 18.3 | 15.8-21.0 | 36.8 | 32.2-41.3 | 63.1 | 56.6-68.8 | 81.8 | 75.2-86.7 | 93.7 | 88.4-96.7 |
| Esophagus - squamous cell carcinoma | 16.6 | 13.2-20.4 | 37.8 | 30.7-44.8 | 60.9 | 50.9-69.4 | 77.0 | 66.4-84.6 | 89.4 | 79.7-94.6 |
| Liver | 22.8 | 21.2-24.5 | 48.9 | 45.9-51.8 | 64.9 | 61.5-68.1 | 78.0 | 74.6-80.9 | 91.8 | 89.0-93.8 |
| Pancreas | 12.6 | 11.5-13.7 | 38.8 | 36.0-41.6 | 63.3 | 59.4-66.9 | 80.9 | 77.0-84.3 | 92.9 | 89.7-95.2 |
| Stomach | 34.4 | 32.5-36.2 | 61.1 | 58.5-63.7 | 80.2 | 77.4-82.6 | 89.9 | 87.4-92.0 | 95.8 | 93.8-97.2 |
| Head and neck | ||||||||||
| Larynx | 63.4 | 59.5-67.0 | 73.2 | 69.2-76.8 | 81.8 | 77.9-85.1 | 88.2 | 84.6-91.0 | 94.1 | 91.1-96.1 |
| Oral cavity and pharynx | 63.7 | 62.0-65.4 | 76.4 | 74.6-78.0 | 85.1 | 83.5-86.6 | 91.6 | 90.1-92.8 | 96.6 | 95.5-97.4 |
| Lip and oral cavity | 65.1 | 62.5-67.6 | 77.9 | 75.3-80.3 | 86.6 | 84.1-88.7 | 92.6 | 90.4-94.2 | 97.2 | 95.6-98.3 |
| Hypopharynx | 30.1 | 23.0-37.5 | 49.7 | 39.2-59.3 | 69.3 | 57.1-78.7 | 79.7 | 67.6-87.6 | 94.4 | 81.6-98.4 |
| Nasopharynx | 68.4 | 61.9-74.0 | 78.6 | 72.0-83.8 | 84.9 | 78.4-89.6 | 91.6 | 85.8-95.2 | 97.0 | 92.1-98.9 |
| Oropharynx | 67.6 | 64.8-70.2 | 78.3 | 75.5-80.8 | 85.7 | 83.1-88.0 | 91.9 | 89.5-93.7 | 96.5 | 94.7-97.8 |
| Thyroid | 98.9 | 98.5-99.1 | 100.0 | 99.7-100.0 | 99.9 | 98.8-100.0 | 99.9 | 99.7-100.0 | 100.0 | ‡ |
| Thyroid - anaplastic | 5.9 | 1.3-15.7 | 32.6 | 7.2-61.9 | 84.2 | 25.3-97.9 | 100.0 | ‡ | 100.0 | ‡ |
| Thyroid - follicular | 98.4 | 92.1-99.7 | 99.5 | 73.2-100.0 | 99.6 | 85.6-100.0 | 99.7 | 96.3-100.0 | 100.0 | ‡ |
| Thyroid - medullary | 90.4 | 79.6-95.6 | 89.7 | 79.3-95.0 | 91.6 | 81.7-96.3 | 94.7 | 85.7-98.1 | 100.0 | ‡ |
| Thyroid - papillary | 99.9 | 99.7-100.0 | 100.0 | ‡ | 100.0 | ‡ | 100.0 | 99.2-100.0 | 100.0 | ‡ |
| Hematological | ||||||||||
| Leukemia | 64.9 | 63.4-66.3 | 83.3 | 81.8-84.7 | 90.2 | 88.8-91.4 | 94.5 | 93.3-95.5 | 97.2 | 96.3-97.9 |
| Acute lymphocytic leukemia | 76.6 | 72.6-80.1 | 89.1 | 85.6-91.8 | 93.4 | 90.4-95.5 | 96.6 | 94.0-98.1 | 98.7 | 96.5-99.5 |
| Acute monocytic leukemia | 91.1 | 88.8-93.0 | 94.8 | 92.6-96.3 | 95.4 | 93.4-96.8 | 96.7 | 94.9-97.9 | 98.1 | 96.6-99.0 |
| Acute myeloid leukemia | 25.8 | 18.0-34.3 | 58.3 | 41.8-71.6 | 78.1 | 56.4-89.8 | 90.2 | 68.7-97.2 | 96.8 | 76.5-99.6 |
| Chronic lymphocytic leukemia | 28.4 | 25.7-31.1 | 55.0 | 50.7-59.2 | 73.9 | 69.0-78.2 | 87.3 | 82.7-90.7 | 94.7 | 90.9-97.0 |
| Chronic myeloid leukemia | 62.9 | 58.7-66.8 | 75.5 | 71.1-79.3 | 84.6 | 80.3-88.0 | 92.6 | 88.9-95.2 | 96.8 | 93.7-98.4 |
| Lymphoma | 73.4 | 72.4-74.4 | 87.3 | 86.3-88.2 | 92.3 | 91.4-93.1 | 95.4 | 94.7-96.1 | 97.9 | 97.3-98.3 |
| Hodgkin lymphoma | 88.2 | 85.8-90.3 | 95.1 | 93.0-96.6 | 96.9 | 95.0-98.1 | 98.5 | 96.8-99.3 | 99.4 | 97.8-99.8 |
| Non-Hodgkin lymphoma | 71.9 | 70.7-72.9 | 86.4 | 85.3-87.4 | 91.7 | 90.7-92.5 | 95.0 | 94.2-95.7 | 97.7 | 97.1-98.2 |
| Non-Hodgkin lymphoma - extranodal | 72.3 | 70.7-73.8 | 87.0 | 85.5-88.4 | 91.7 | 90.2-92.9 | 95.0 | 93.7-96.0 | 97.5 | 96.6-98.2 |
| Non-Hodgkin lymphoma - nodal | 71.4 | 69.9-73.0 | 85.7 | 84.2-87.1 | 91.7 | 90.3-92.9 | 95.0 | 93.8-96.0 | 97.9 | 97.0-98.5 |
| Myeloma | 54.8 | 52.6-56.9 | 67.8 | 65.4-70.1 | 73.7 | 71.3-75.9 | 81.5 | 79.2-83.6 | 89.5 | 87.5-91.2 |
| Melanoma | ||||||||||
| Melanoma of the skin | 88.7 | 87.6-89.7 | 92.1 | 91.0-93.0 | 94.9 | 94.0-95.7 | 96.8 | 96.1-97.5 | 98.3 | 97.7-98.8 |
| Melanoma (non-cutaneous) | 73.3 | 67.3-78.3 | 77.6 | 71.7-82.5 | 82.0 | 76.1-86.5 | 90.2 | 84.8-93.7 | 95.4 | 90.6-97.7 |
| Melanoma - mucosal | 47.0 | 34.1-58.9 | 59.1 | 43.4-71.7 | 67.5 | 50.5-79.8 | 82.8 | 63.1-92.5 | 89.8 | 68.5-97.0 |
| Melanoma - ocular | 80.5 | 73.8-85.6 | 81.7 | 75.2-86.7 | 85.0 | 78.6-89.6 | 91.5 | 85.7-95.0 | 96.2 | 91.1-98.4 |
| Thoracic system | ||||||||||
| Lung | 24.8 | 24.1-25.4 | 49.8 | 48.7-50.9 | 66.4 | 65.1-67.6 | 79.0 | 77.7-80.2 | 90.0 | 89.0-91.0 |
| Lung - adenocarcinoma | 32.6 | 31.5-33.7 | 54.6 | 53.0-56.1 | 69.6 | 67.9-71.2 | 80.3 | 78.7-81.9 | 89.9 | 88.5-91.1 |
| Lung - large cell | 21.5 | 16.7-26.8 | 46.2 | 36.8-55.0 | 65.0 | 53.8-74.1 | 81.2 | 69.9-88.5 | 93.2 | 83.4-97.3 |
| Lung - small cell | 6.9 | 5.9-8.1 | 21.4 | 18.4-24.6 | 45.1 | 39.5-50.4 | 69.2 | 62.2-75.1 | 89.1 | 83.0-93.1 |
| Lung - squamous cell | 24.9 | 23.3-26.5 | 45.6 | 43.0-48.1 | 61.6 | 58.5-64.5 | 75.7 | 72.5-78.5 | 88.0 | 85.2-90.3 |
| Urinary system | ||||||||||
| Bladder | 79.1 | 77.8-80.2 | 88.0 | 86.9-89.1 | 92.3 | 91.3-93.3 | 95.2 | 94.3-96.0 | 97.5 | 96.8-98.1 |
| Kidney | 79.0 | 77.7-80.3 | 89.8 | 88.5-90.9 | 93.0 | 91.9-94.0 | 95.3 | 94.3-96.1 | 97.9 | 97.1-98.4 |
Abbreviations: CI means confidence interval; RSR means relative survival ratio.
Symbols:
†Zero years survived is the equivalent of non–conditional survival.
‡Estimate could not be calculated.
Notes:
- Analysis was restricted to ages 15 to 99.
- Bladder cancer includes carcinoma in situ cases.
Analysis by: Surveillance, Ontario Health (Cancer Care Ontario)
Data source: Ontario Cancer Registry (March 2021), Ontario Health (Cancer Care Ontario)